Entry 1: Kickstarting My Project
In this entry, I will be setting up a data pipeline and taking a first look at some contrails data.
To begin, I setup the Google Contrails API, which returns a dataset containing longitude, latitude, altitude (flight level), datetime, and contrail forcing index values ranging from 0 (None) to 4 (Extreme). The provided sample code on the website allowed me to practice requesting data for one specific datetime.
I then modified the code to import a week’s worth of data into a simple, local SQLite database in around 6-hour intervals. I verified the data had been imported using SQL queries.
Then I generated some plots from the data to get some first glimpses into what the data looks like.
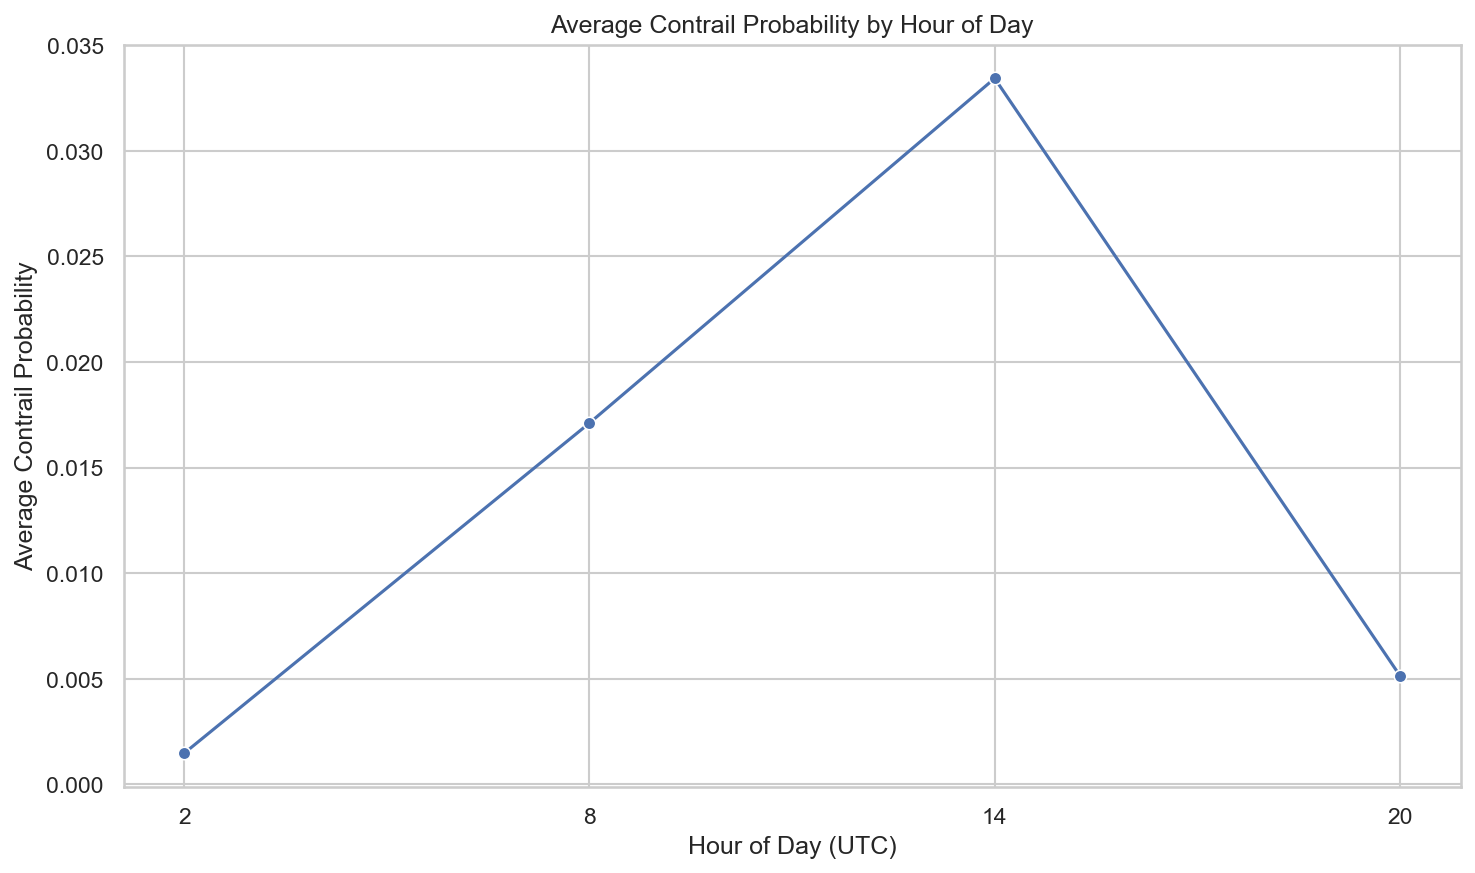
Average Contrail Forcing Index (CFI) by Hour of Day
With only four times of the day across 6-hour intervals, it is difficult to make any strong observations. But something that can be noticed below is that contrail forcing index peaks at around 14 UTC (00:00 Australian Eastern Standard Time or AEST). It seems to be lowest at 2 UTC or 12:00 PM noon AEST.
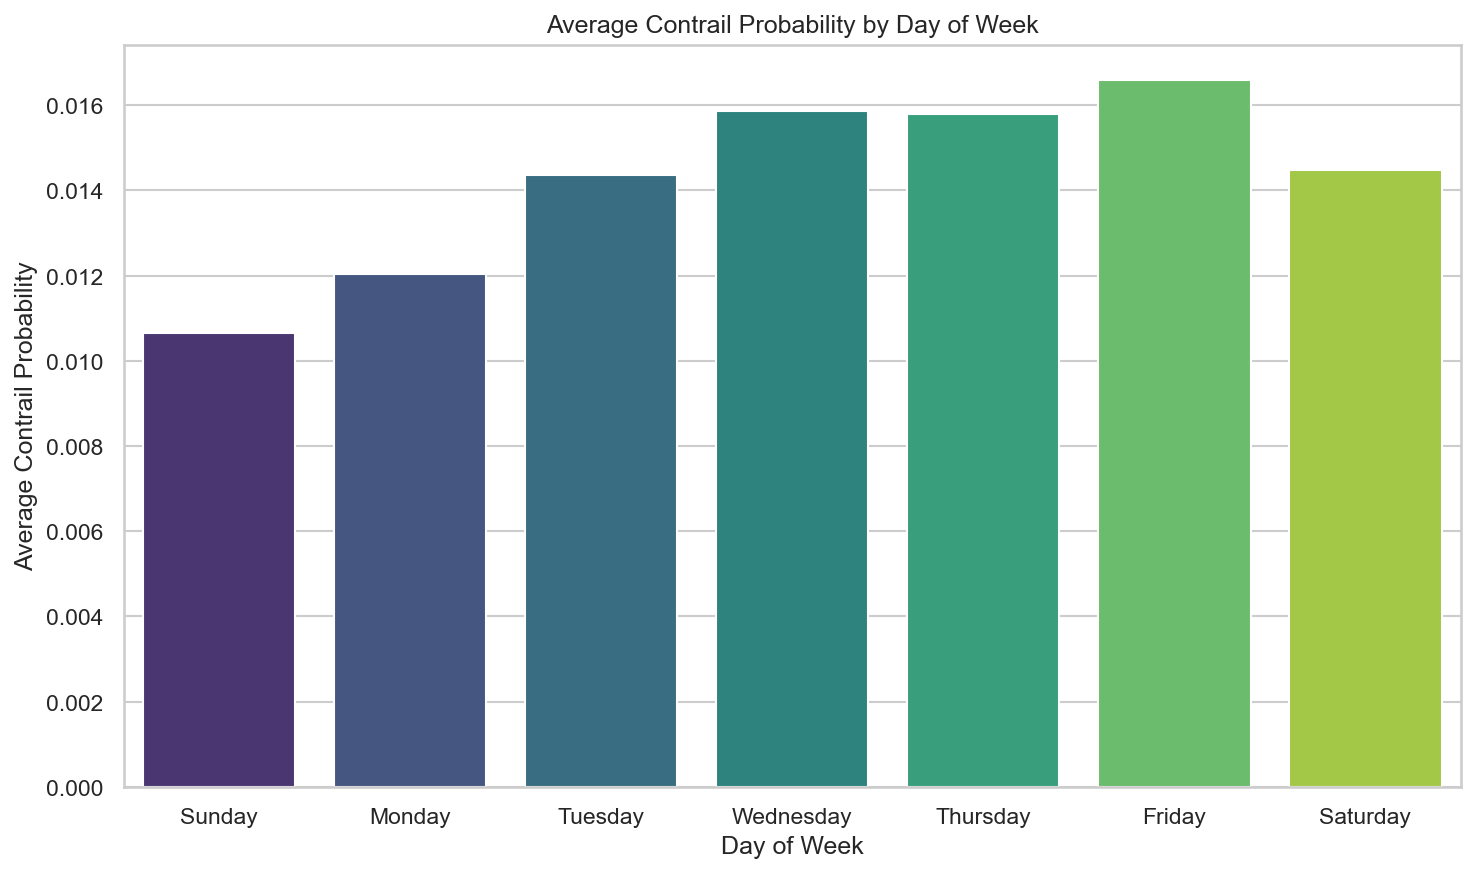
Contrail Forcing Index (CFI) by Day of Week
This plot shows the distribution of CFI across the days of the week. There is not significant variation in CFI, but it can be observed that Sunday has the lowest and Friday has the highest.
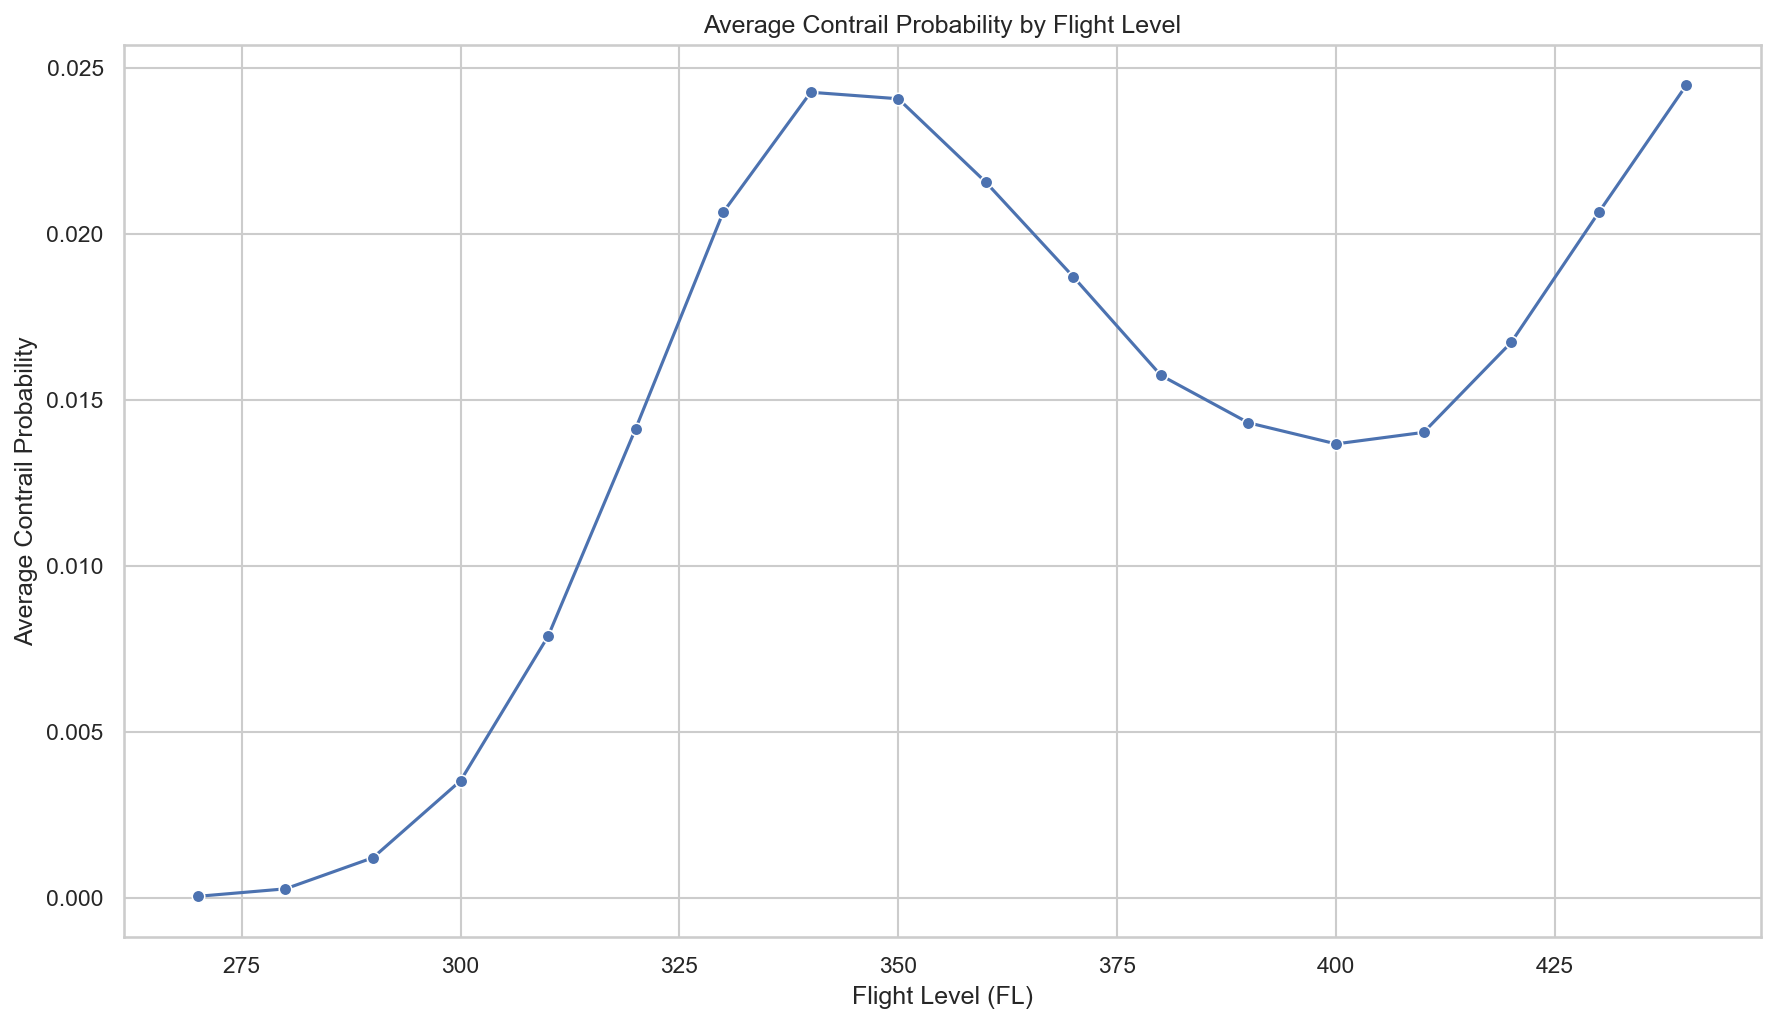
Contrail Forcing Index (CFI) by Flight Level
This is an interestingly shaped plot. A notable altitude for high contrail formation likelihood appears to be between 32,500 ft and 35,000 ft.
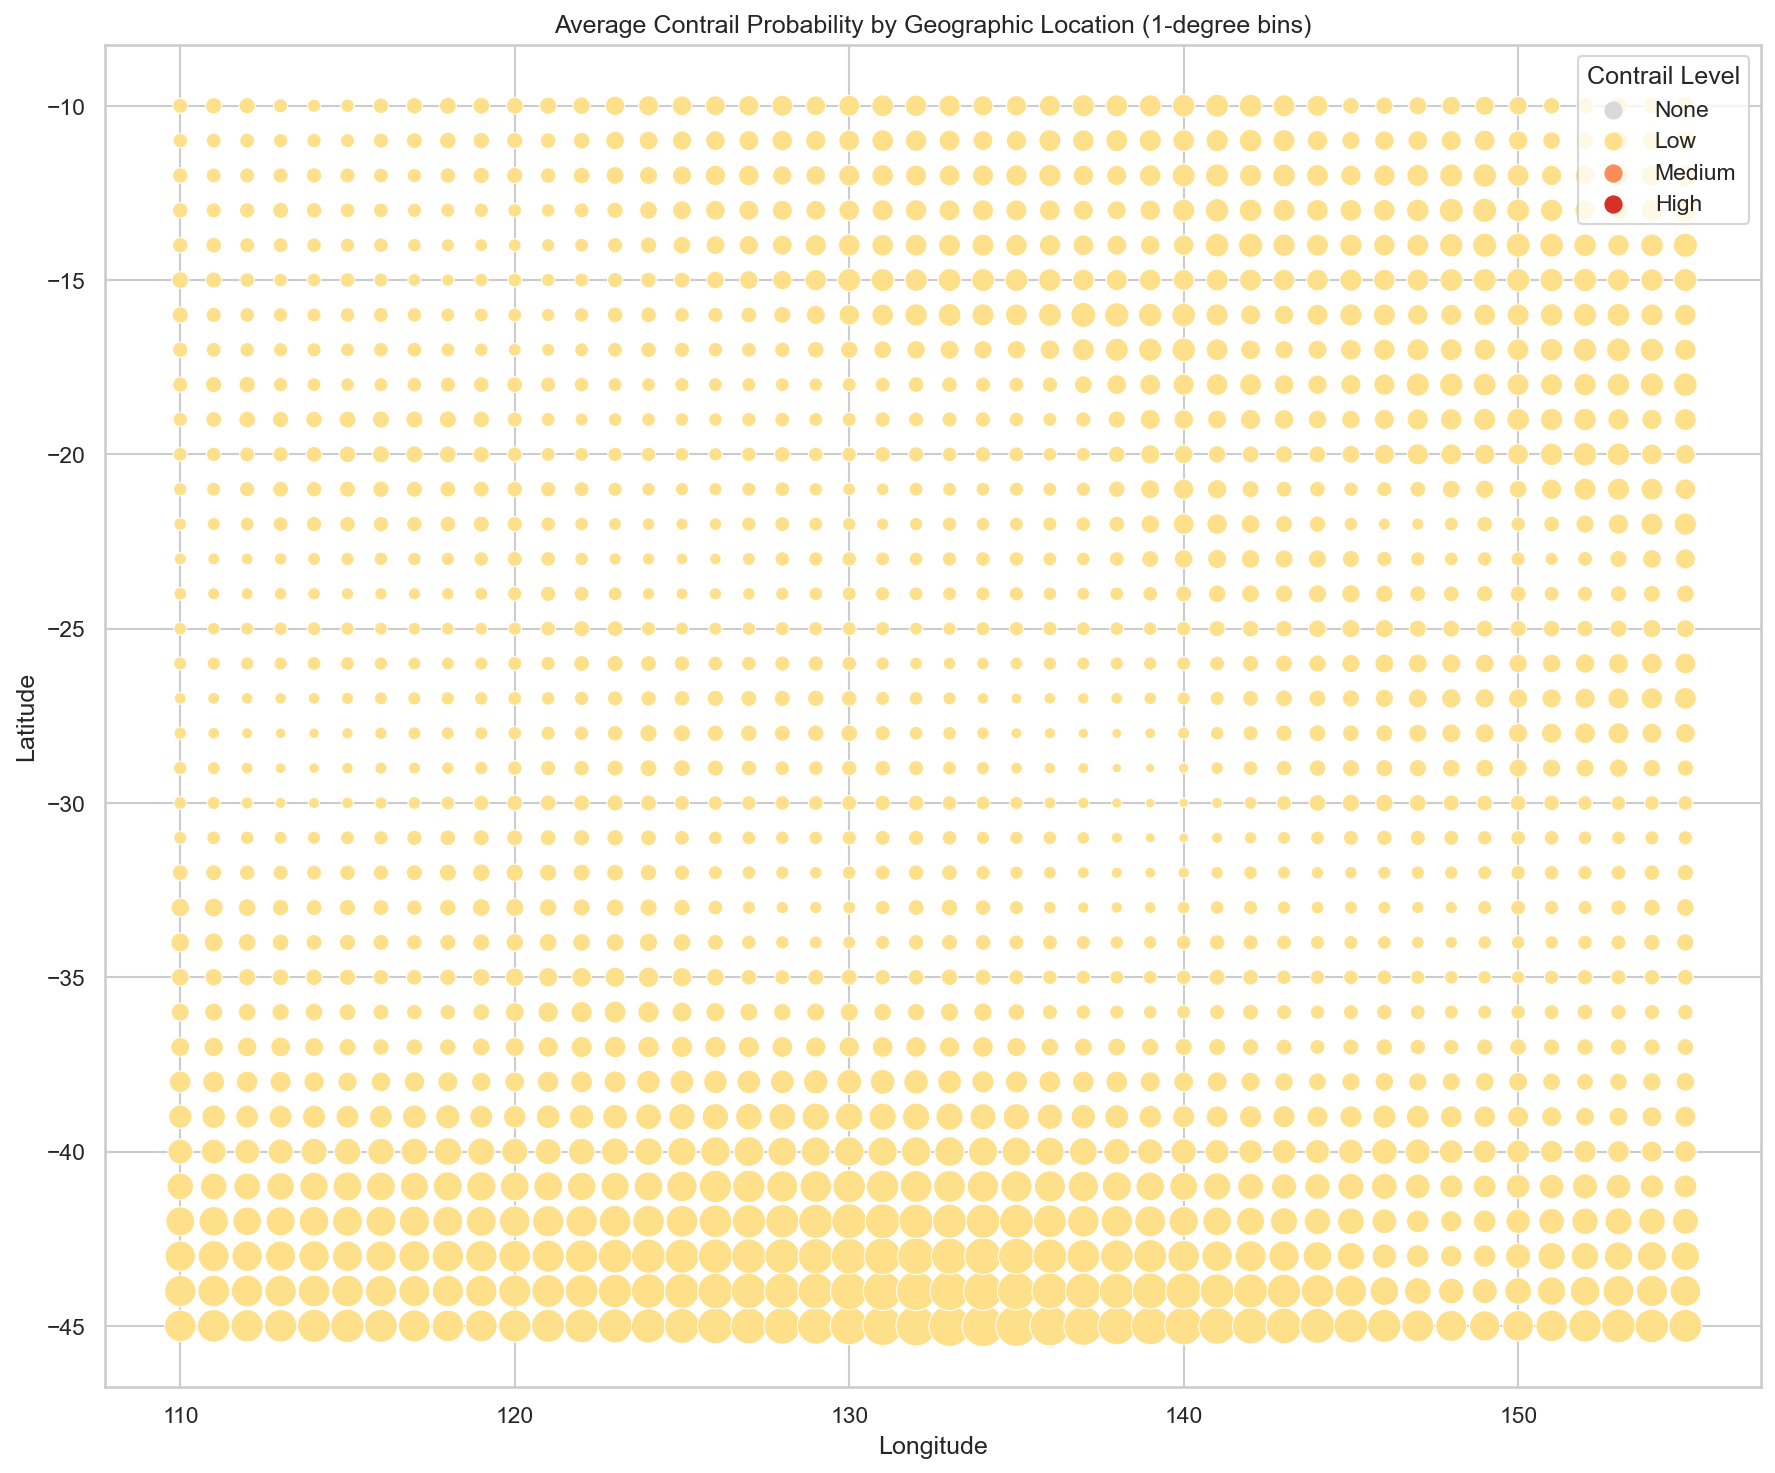
Contrail Forcing Index (CFI) by Location
The bounds are AUS_BOUNDING_BOX = (-45, 110, -10, 155) which covers mainland Australia and surrounding waters (Bass Strait, Tasman Sea, part of the Southern Ocean). There is not much diversity in the dots in the heatmap, most of them show a low CFI.
Certainly an interesting first glimpse at the data I will be working with, which is already showing some trends! I will be curious to see whether these larger trends in the dataset will remain the same after importing a larger set of data from the API.