Photo by Gabriela Natiello on Unsplash
Looking At Contrail Formation in Australian Skies
What are those white lines in the air next to planes? This website will document my findings as I look at where, when and why contrails form in Australian skies.
A summary of my findings so far
Research question: Where and when do flights in Australian skies pass through contrail-forming air, and what would avoiding it involve for regional and FIFO charter flights?
Data: Contrail forecasts from the Google Contrails API (a 0–4 severity index from a weather-forecast model) for winter 2025 and April 2026, matched with ADS-B flight tracks from ADSB.fi and BITRE domestic route statistics.
Key findings:
- The contrail forcing index over Australian skies in winter 2025 was highest overnight (14 UTC, midnight AEST) and lowest around midday (02 UTC): Entry 3. Matched flight data from April 2026 showed the same overnight pattern, with the share of aircraft in contrail-forming air peaking at 15 UTC: Entry 7
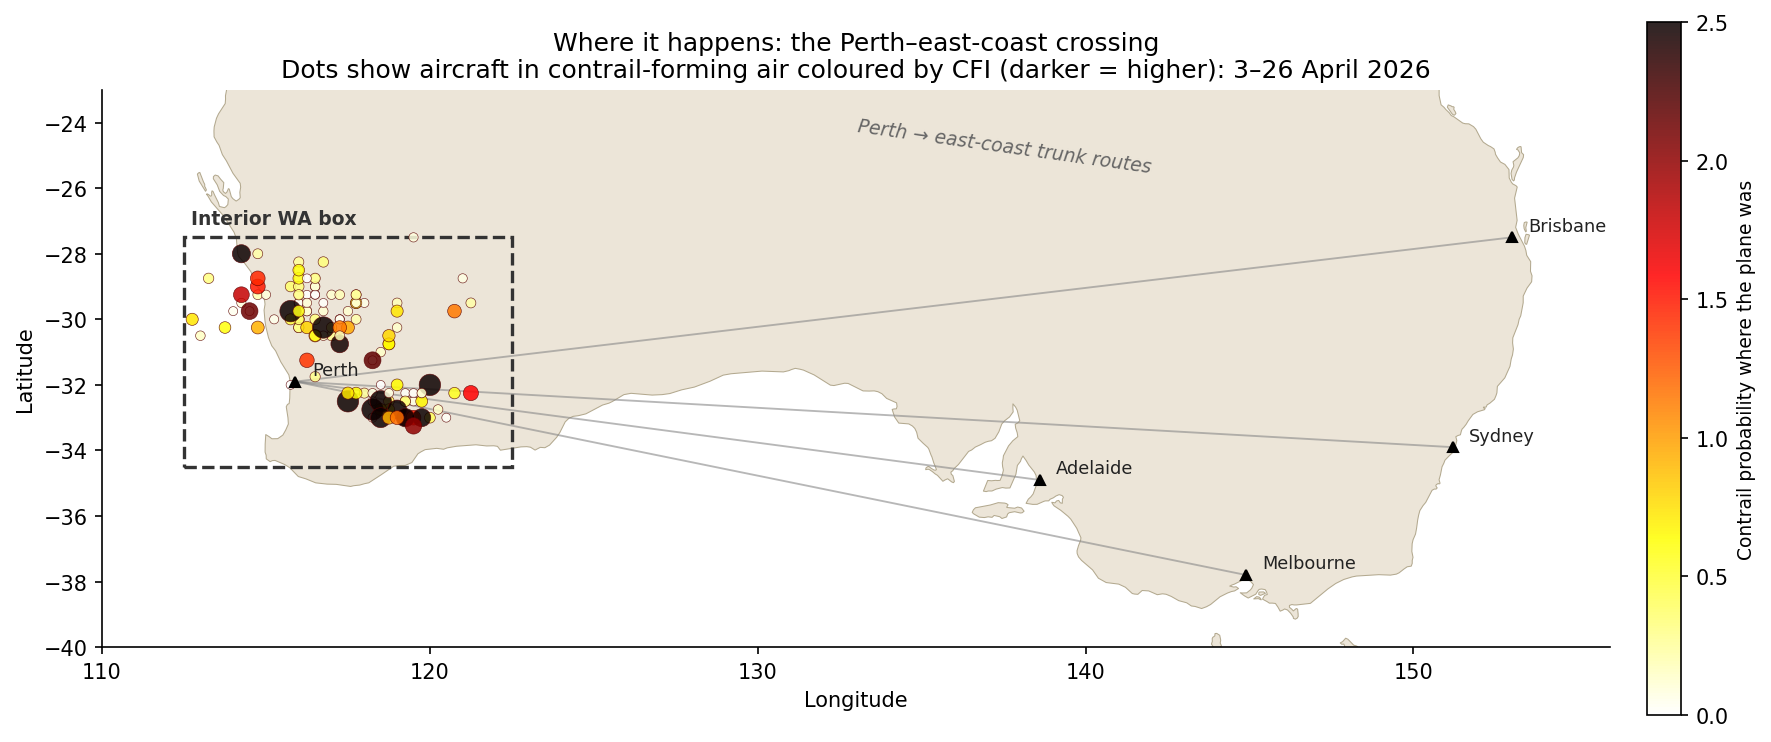
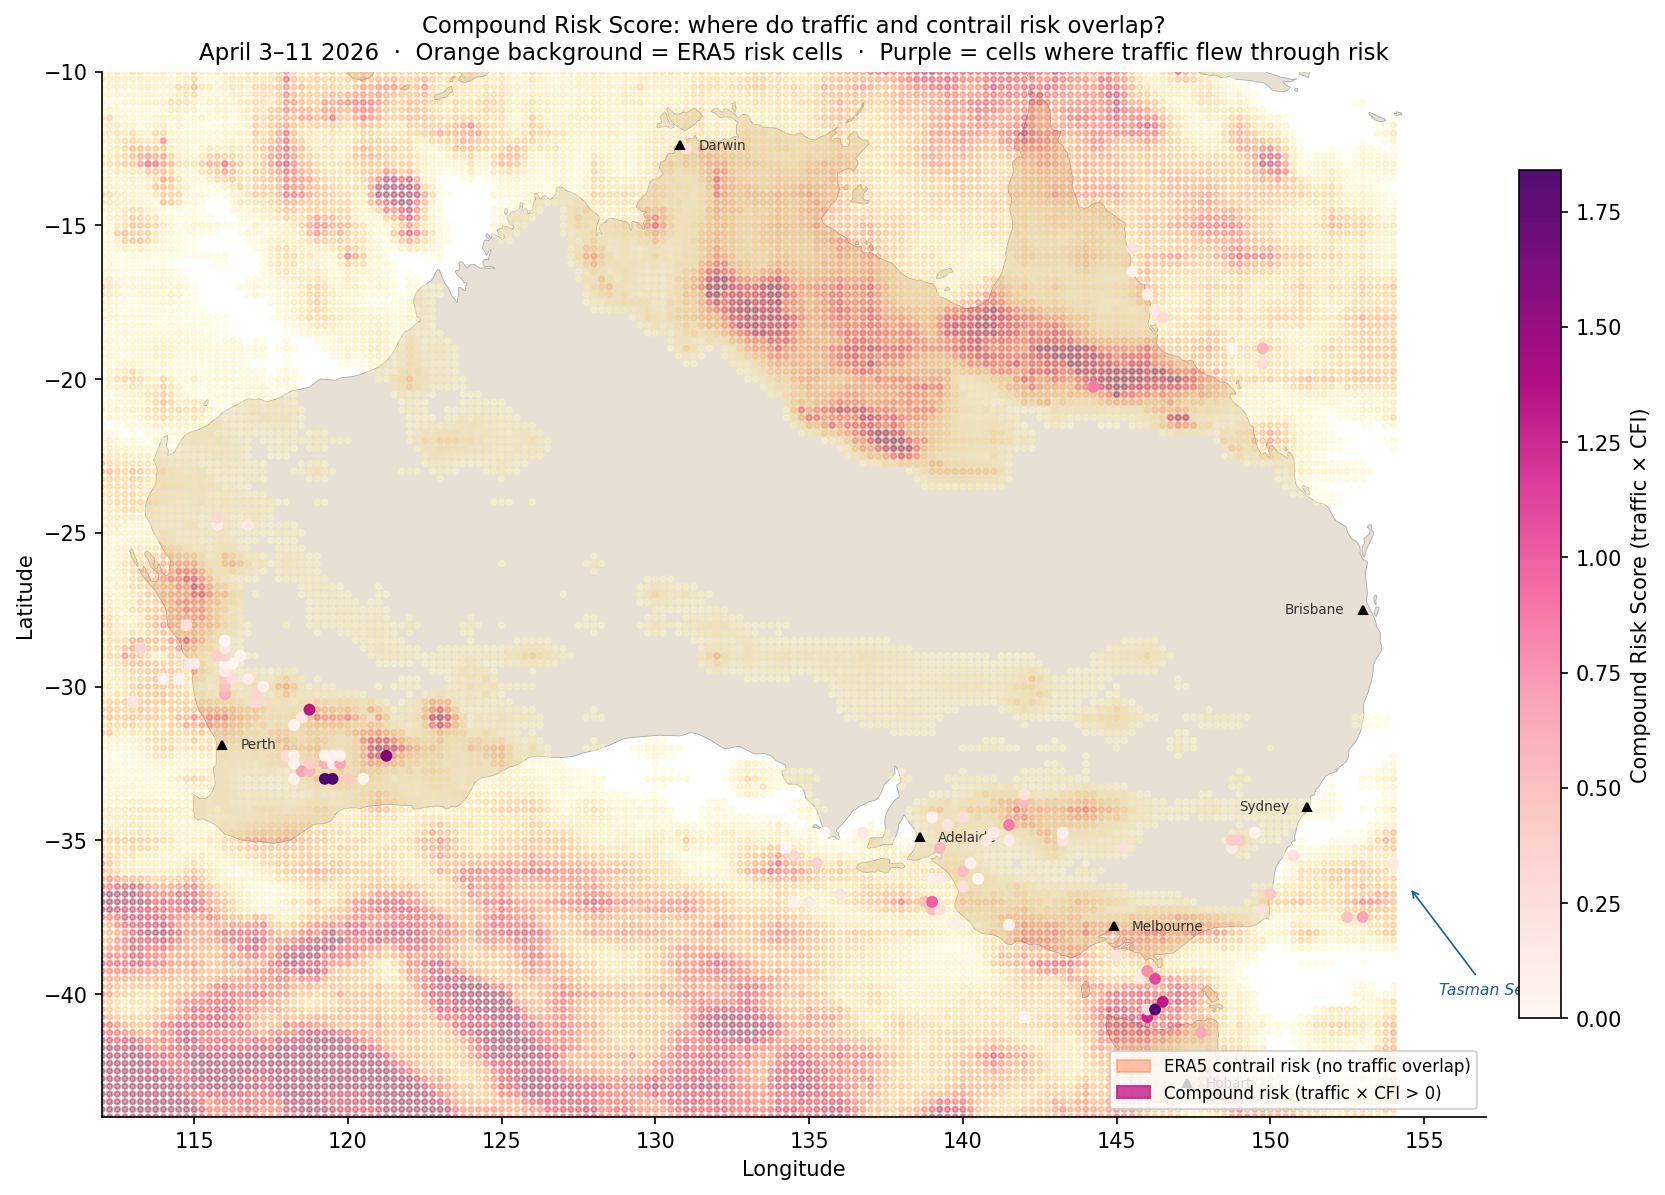
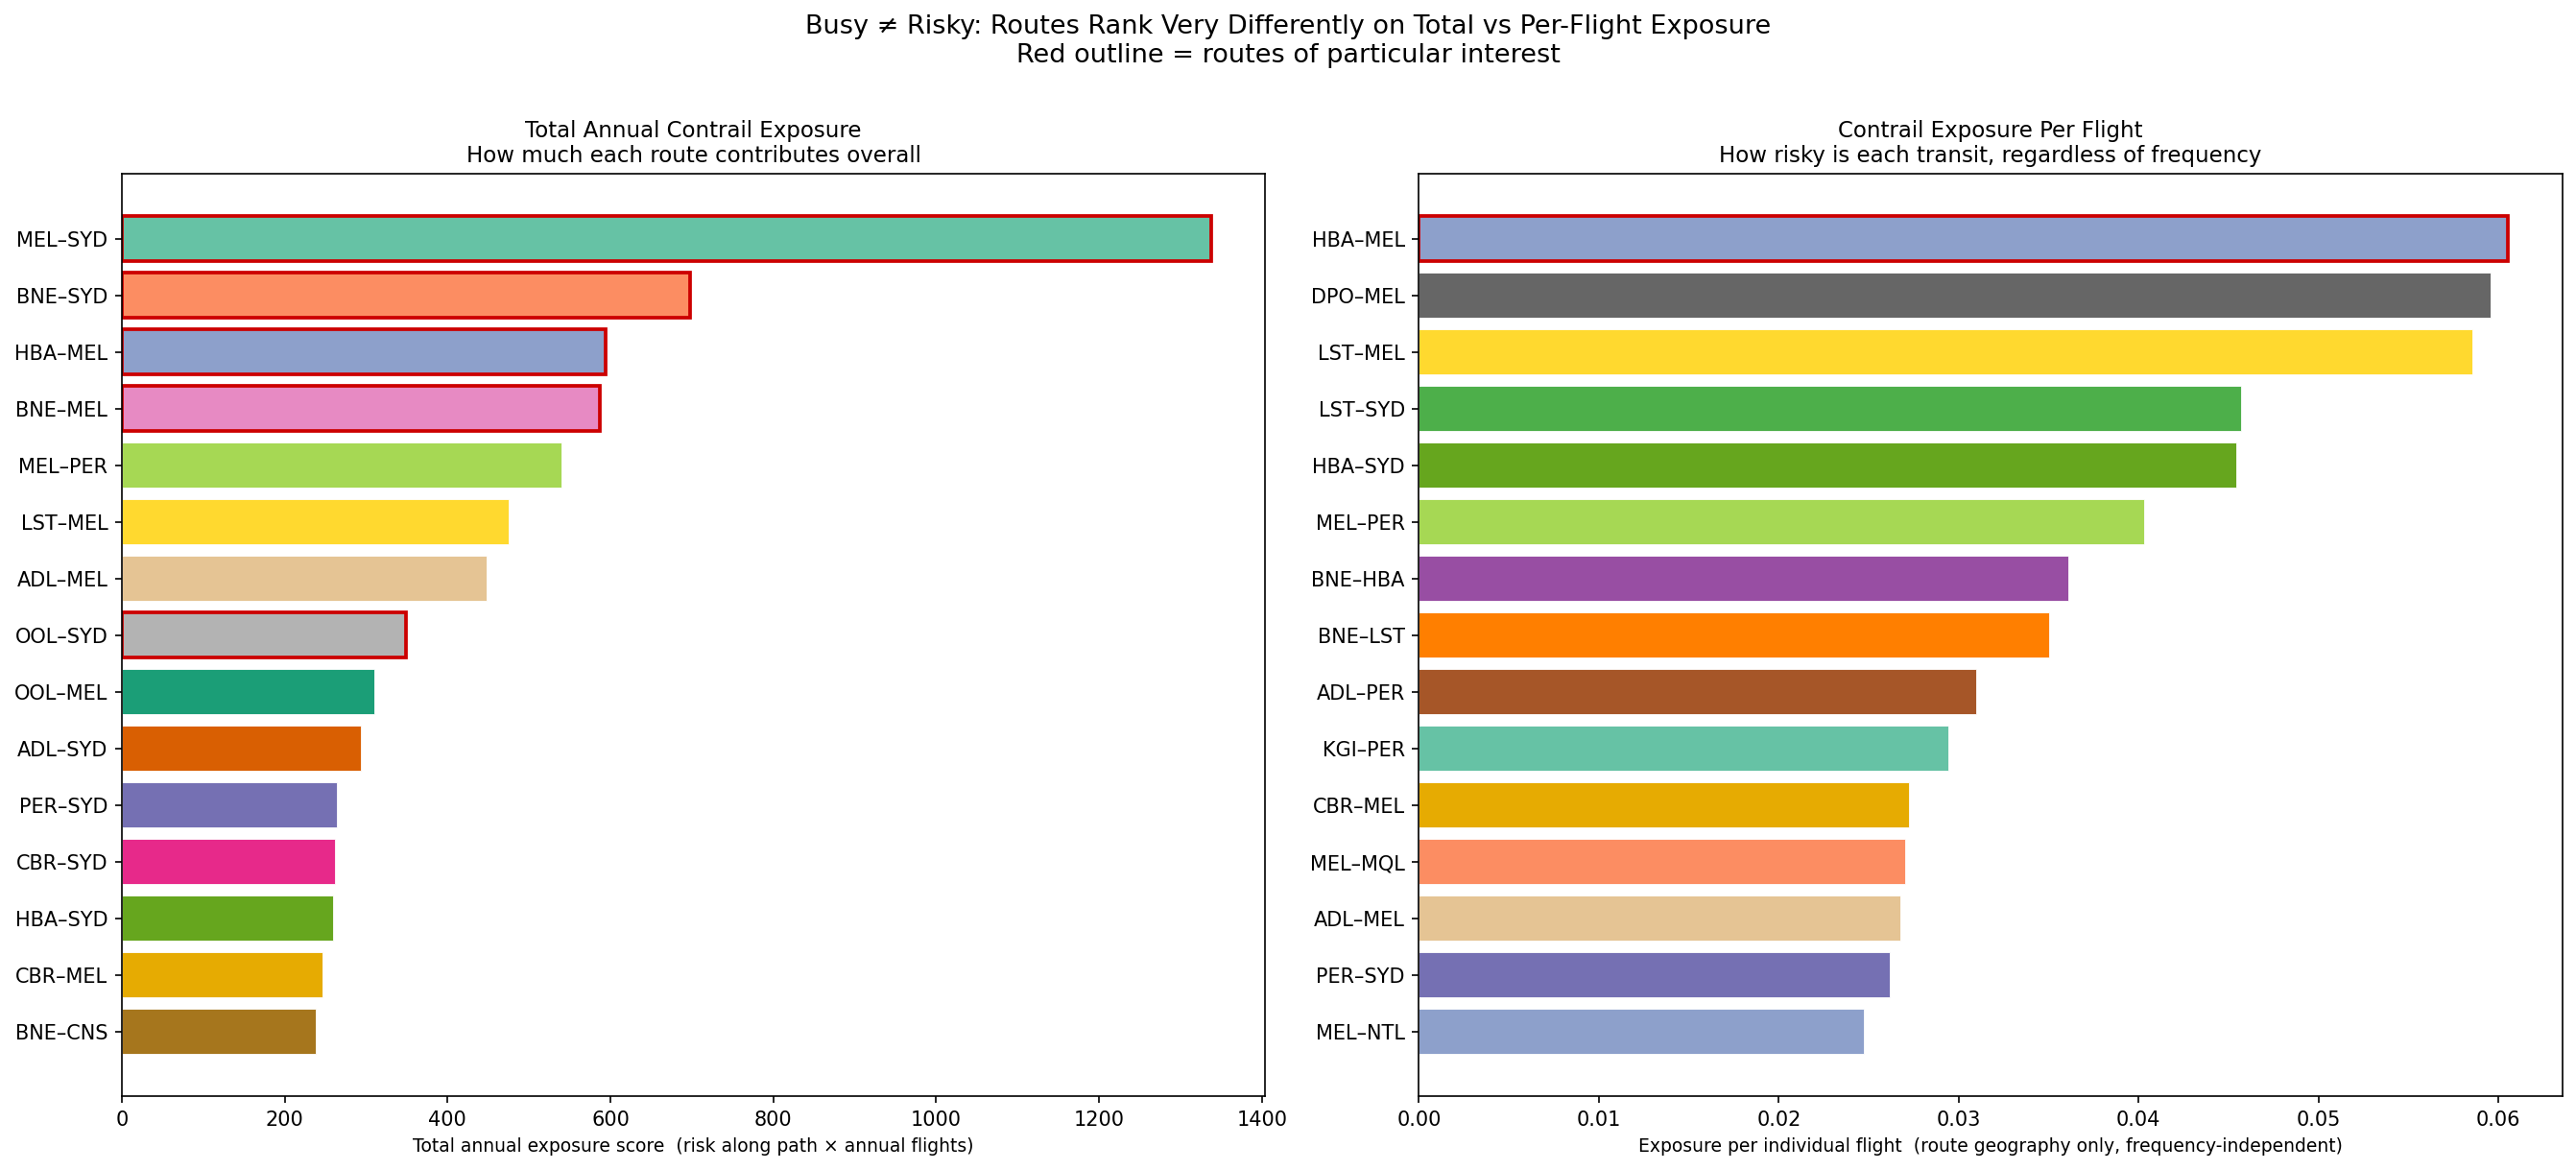
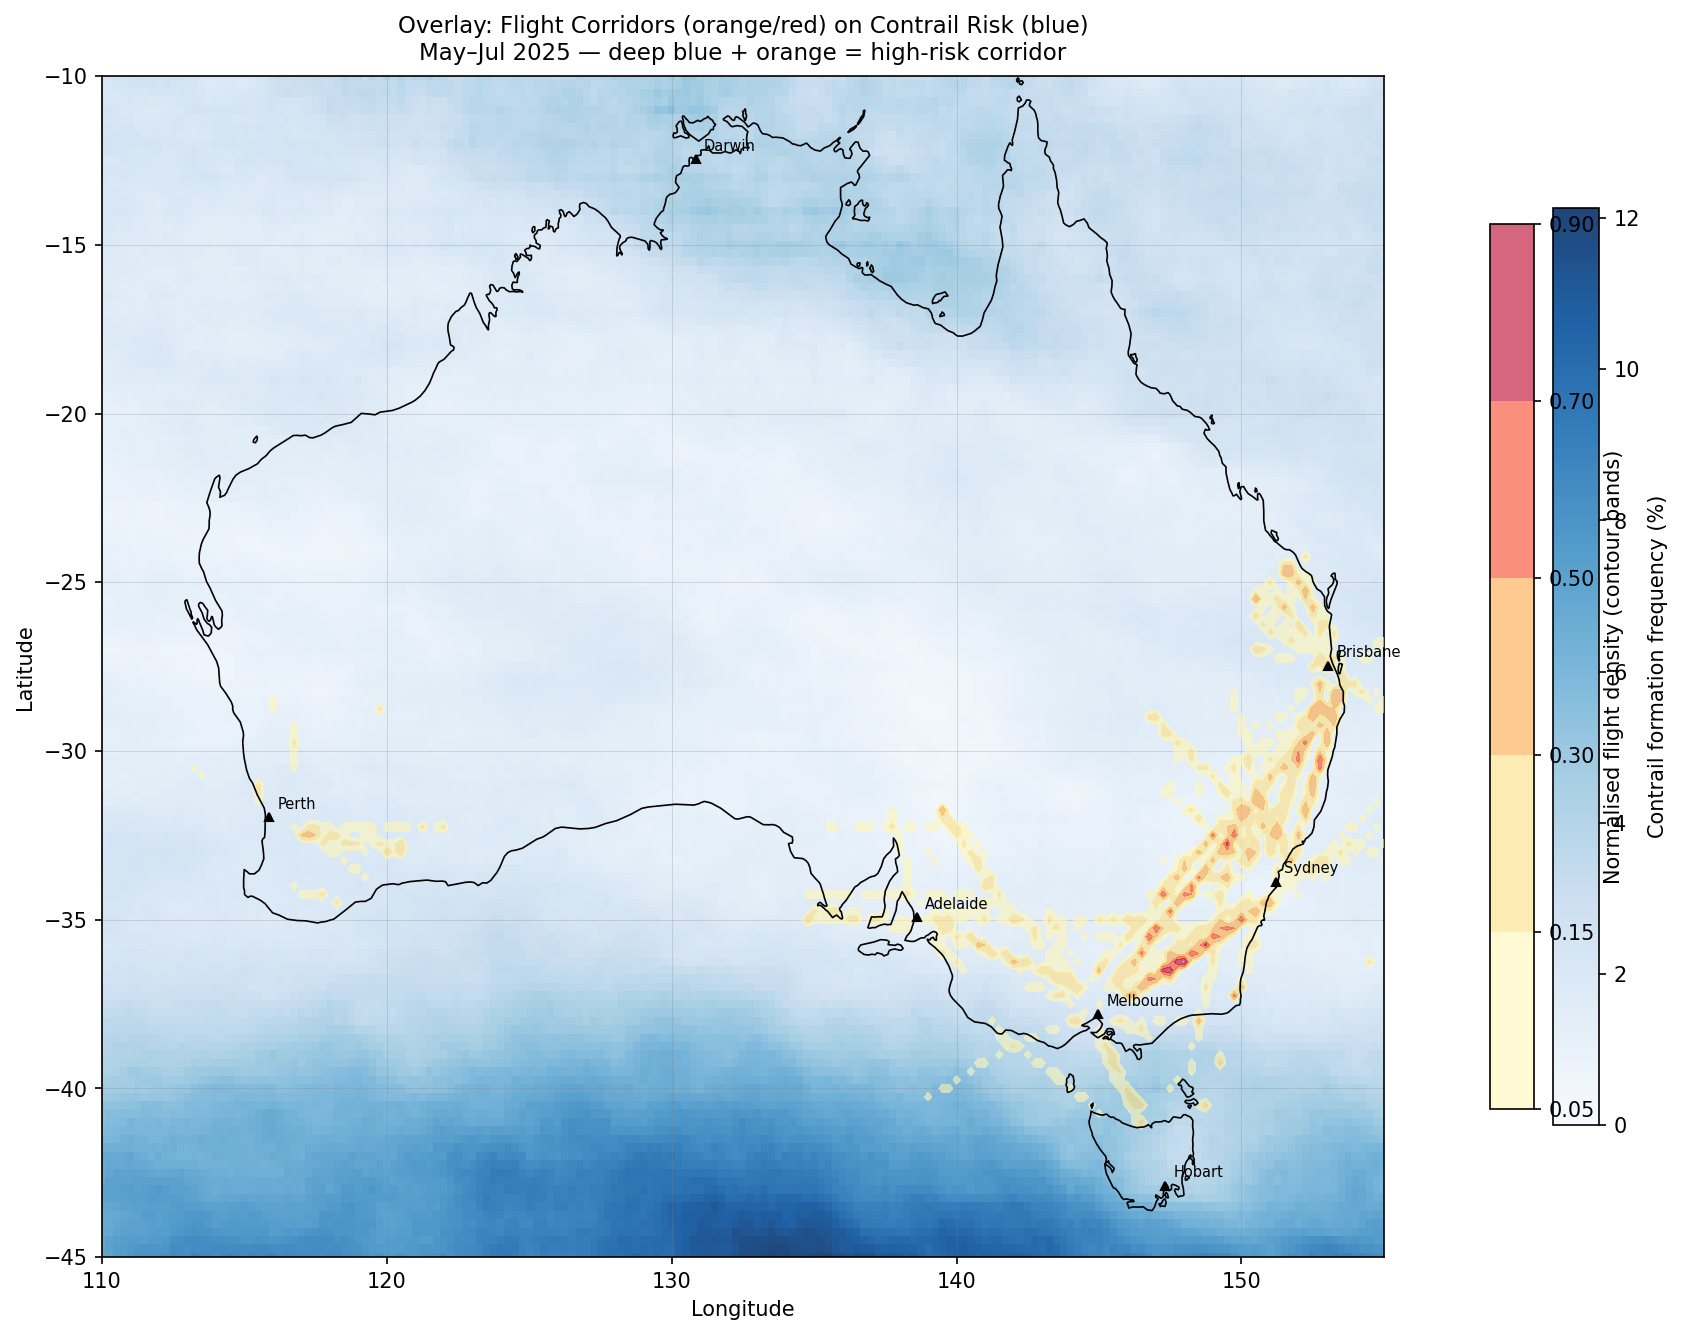
- Some regions of interest were identified when pairing contrail forcing index with air traffic data: Hobart to Melbourne over the Bass Strait (the most contrail-prone route per flight, 2.5x Melbourne to Sydney), the Melbourne to Sydney corridor and interior WA: Entry 5, Entry 6, Entry 7, Entry 8
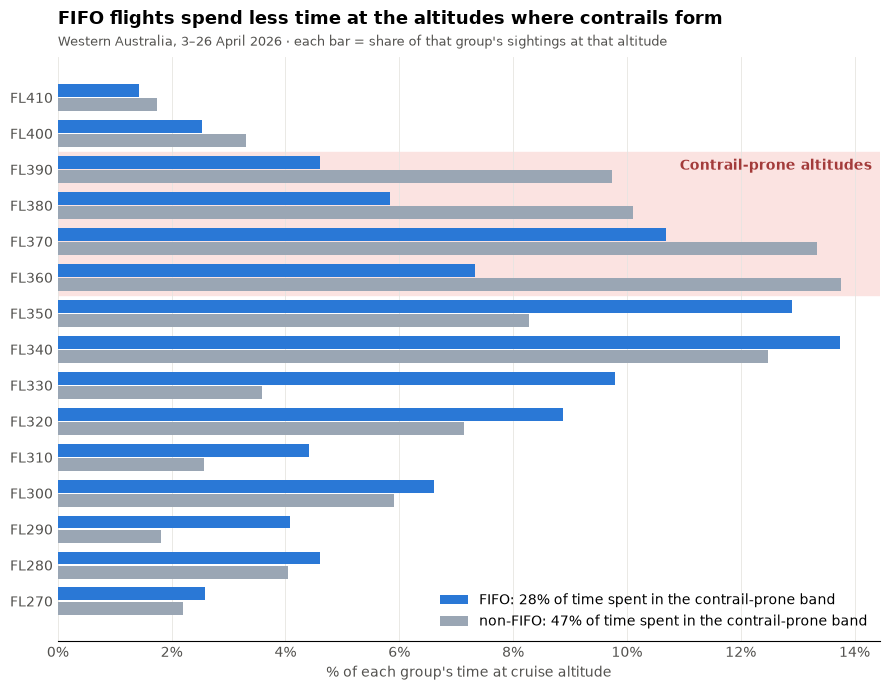
- In WA, 2.1% of fly-in, fly-out (FIFO) flights passed through contrail-forming air compared with 2.9% of non-FIFO flights. This small difference is not yet statistically significant, but could possibly be explained by the smaller aircraft used for many FIFO operations: Entry 10, Entry 11
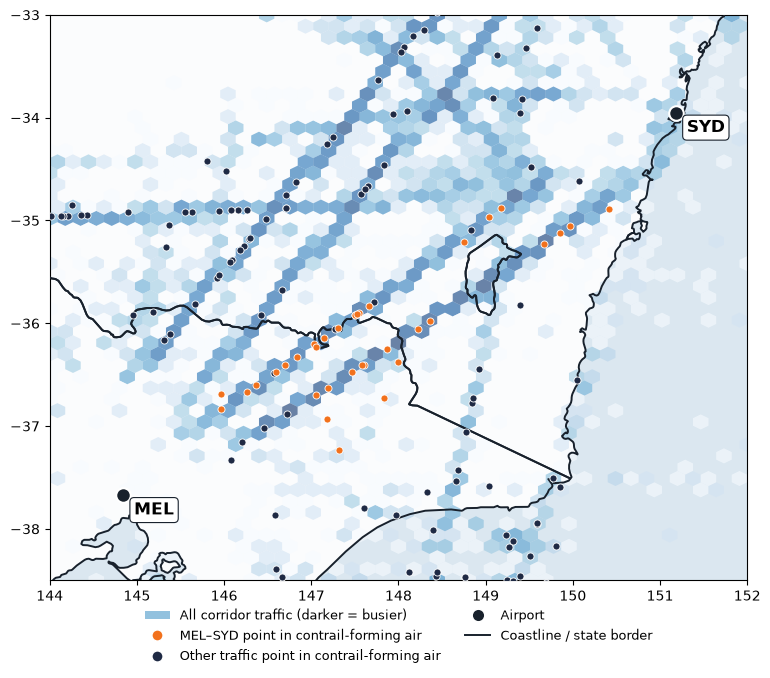
- On the Melbourne to Sydney corridor, Melbourne–Sydney flights were in contrail-forming air at about 3.9x the rate their share of traffic would predict: Entry 12. However, most of the hits captured across four days were mostly attributed to two of the days, so more data is needed to confirm these results.
How I Measured Contrail Exposure:
In all of my entries so far, I have used different measures to assess contrail risk. These include:
- Mean CFI: average contrail forcing index score (0-4) over the whole period
- Exposure Index: how busy a square is (air traffic) multiplied by how often it has contrail conditions, both scaled from 0-1
- Per-flight route score: draws a straight path between 2 airports and averages the contrail risk of every square it crosses
- Compound Risk Score: how many aircraft sightings multiplied by average CFI score (with more refined data compared to Exposure Index)
- Share of At-Risk Sightings: percentage of all aircraft sightings inside a contrail-forming square at that moment
- Hit Rate: percentage of sightings in contrail-forming air split by route group
- Per-Flight Hit Rate: percentage of flights with at least one sighting in contrail-forming air
Limitations: Short data windows, rough FIFO labelling, the Google Contrails data is the output of a model rather than data containing actual contrails.
Next steps: collecting more days and months of matching ADSB.fi & Contrails data to test whether FIFO and SYD-MEL results hold up, looking at small altitude or departure-time changes for at-risk FIFO flights, improved labeling of FIFO vs non-FIFO flights, looking at altitude changes in main routes for Melbourne-Sydney route, matching traffic data and contrails data for the Hobart to Melbourne route, looking at Tasman Sea routes between Australia and New Zealand.
The entries below show the findings in more detail, from first look at the data to the latest analysis.
Posts
-
Entry 12: Contrails on the Busy SYD-MEL Route
Looking at the merged ADS-B and Contrails dataset in the popular Sydney to Melbourne flight corridor as a comparison to FIFO flights in Interior WA.
-
Entry 11: Do FIFO flights enter contrail-forming regions?
Bringing in the contrails dataset with the labeled FIFO vs non-FIFO ADS-B dataset of Australian aircraft over Western Australia to identify whether FIFO flights enter contrail-prone regions.
-
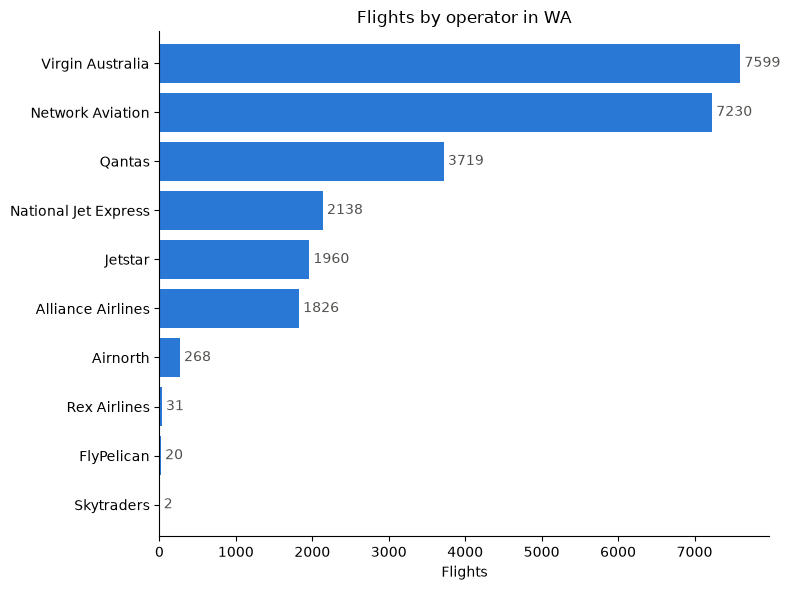
Entry 10: A More Accurate Picture of FIFO Flights
Improving the filtered ADS-B dataset to classify Australian flights over Western Australia as FIFO vs non-FIFO using origin/destination and flight numbers.
-
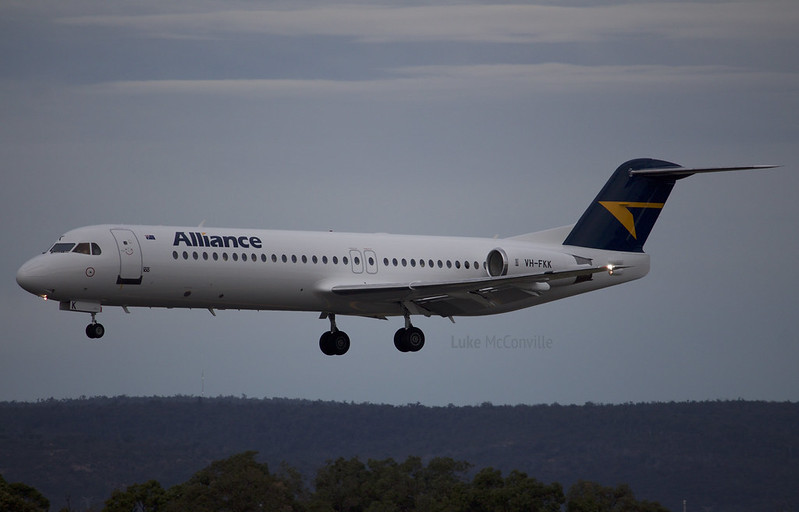
Entry 9: Exploring FIFO Charter Flights
Researching what fly-in, fly-out (FIFO) work is and filtering ADS-B traffic data to visualise and better understand FIFO flight scheduling.
-
Entry 8: Examining Interior WA
Looking at a bigger set of matched contrails and ADS-B data to reveal where contrail hotspots may be in Western Australia in April 2026.
-
Entry 7: When Real Flights Meet Contrail Skies
This time, contrail data is matched with ADS-B flight traffic data covering the same window in Autumn 2026 to see where busy skies and contrail-prone areas overlap.
-
Entry 6: Charting Australia’s Domestic Skies
Taking a look at Australia's domestic flight network with government data to find out which routes carry the most traffic, and how do they align with contrail-prone skies?
-
Entry 5: Adding in Flight Data
Overlaying real ADS-B flight traffic data on contrail risk maps to find where Australia's busiest corridors intersect with high contrail forcing index values.
-
Entry 4: The Complex Nature of Contrails
Looking at an article which puts into perspective how complicated contrail-avoidance is in relation to my own observations so far with the Google dataset.

-
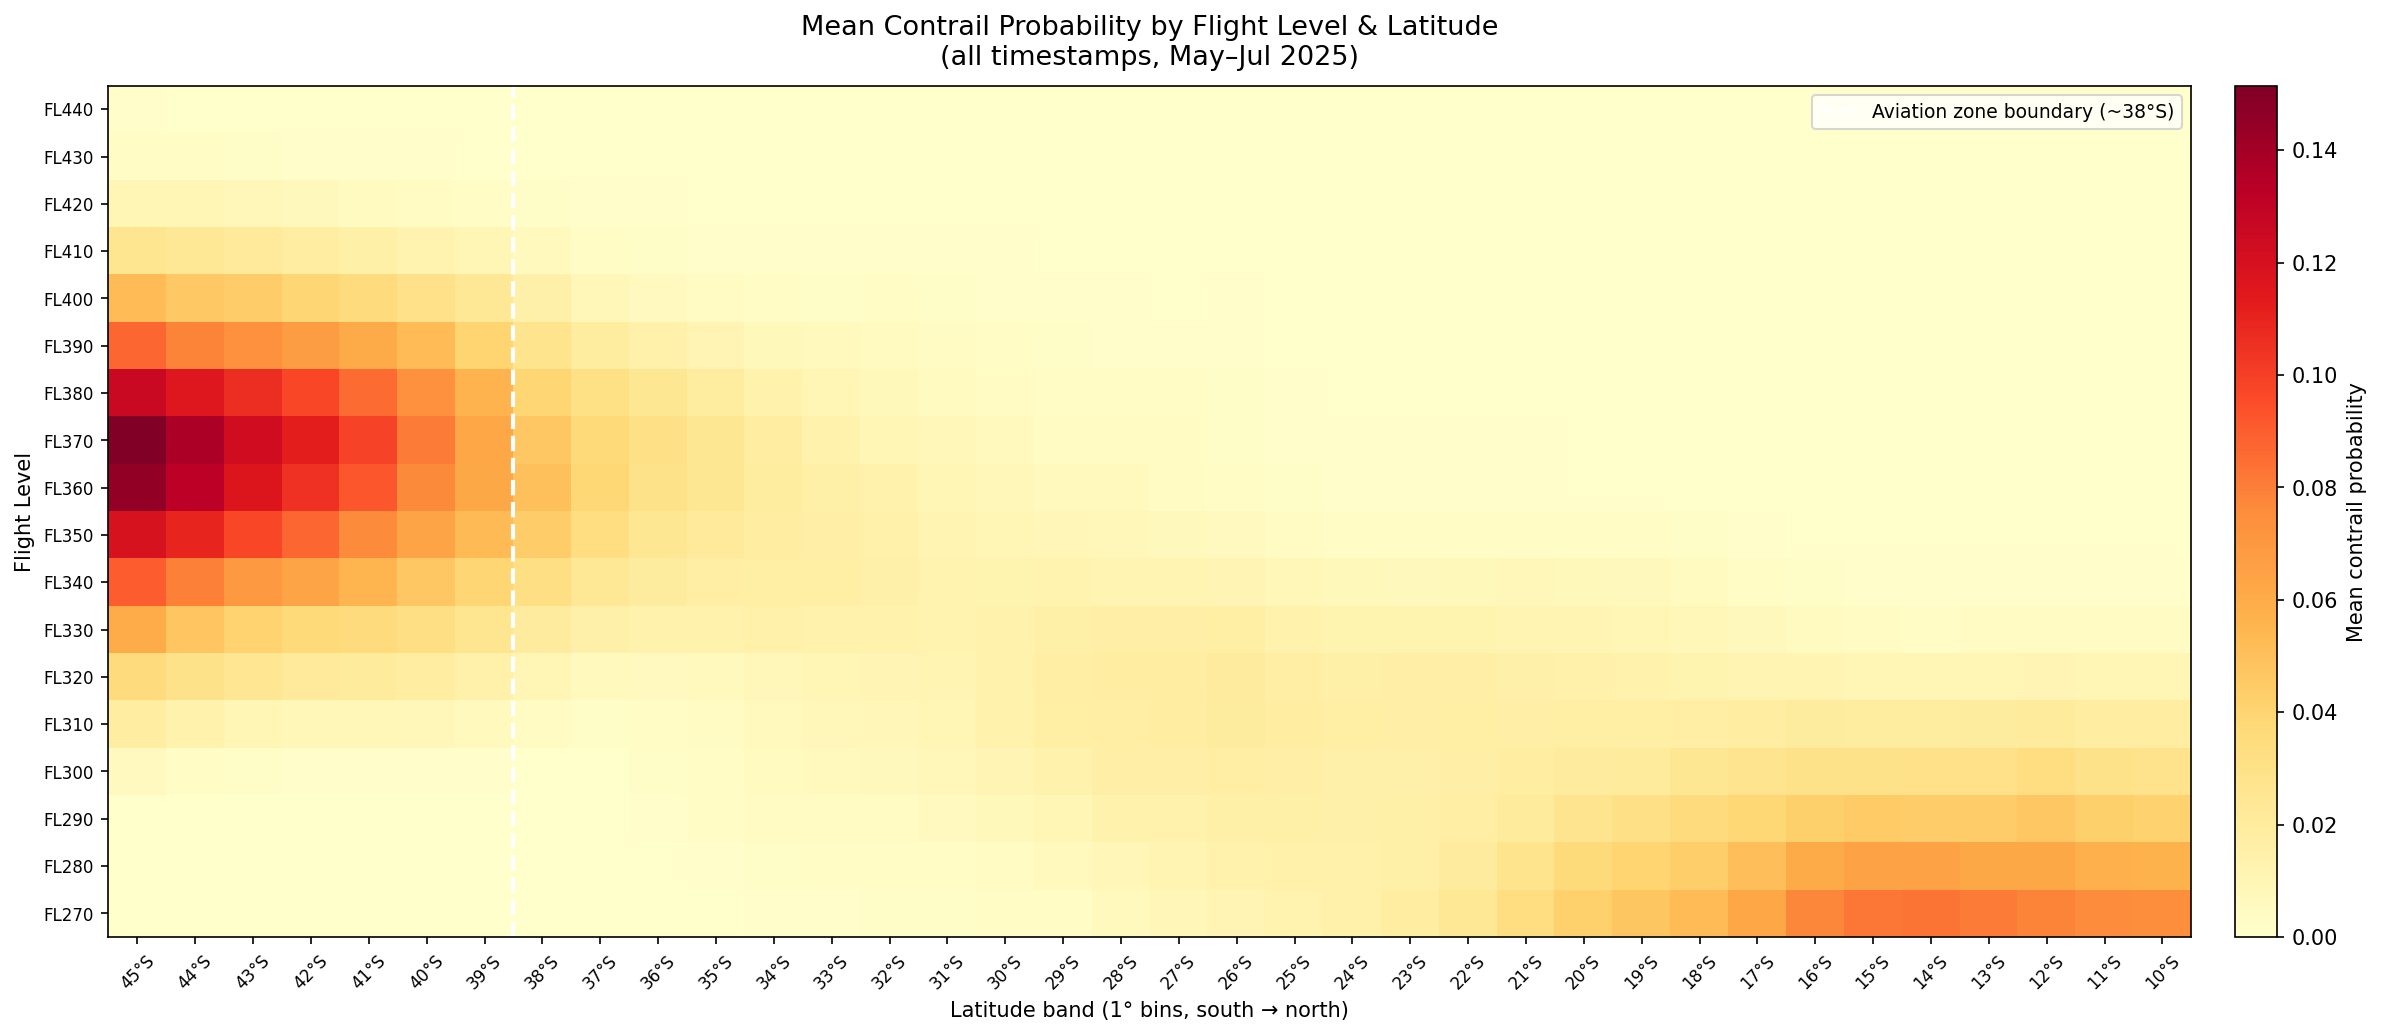
Entry 3: Contrails with Respect to Latitude, Altitude and Time
Breaking down contrail forcing index by latitude, flight level, and time of day with interesting observations in the Southern Ocean.
-
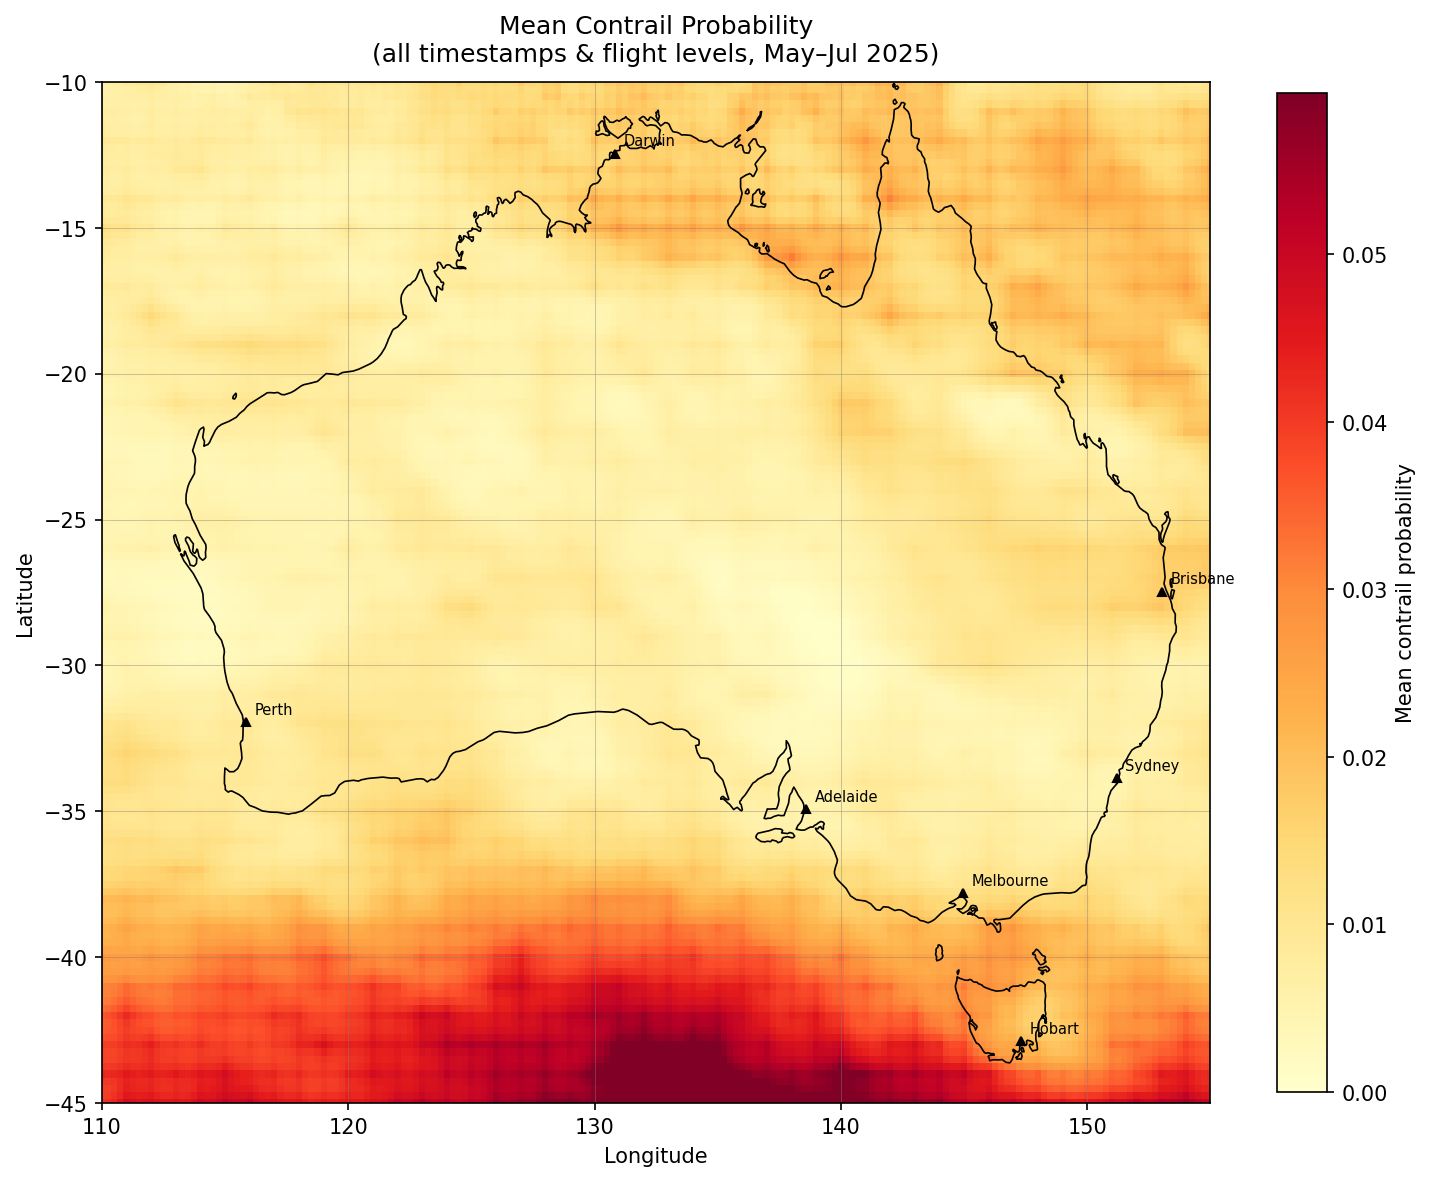
Entry 2: Database Migration and Starting Geospatial Analysis
Migrating to PostgreSQL for a 60-day Australian dataset and mapping contrail hotspots geospatially to find where contrails form most frequently and intensely across the continent.
-
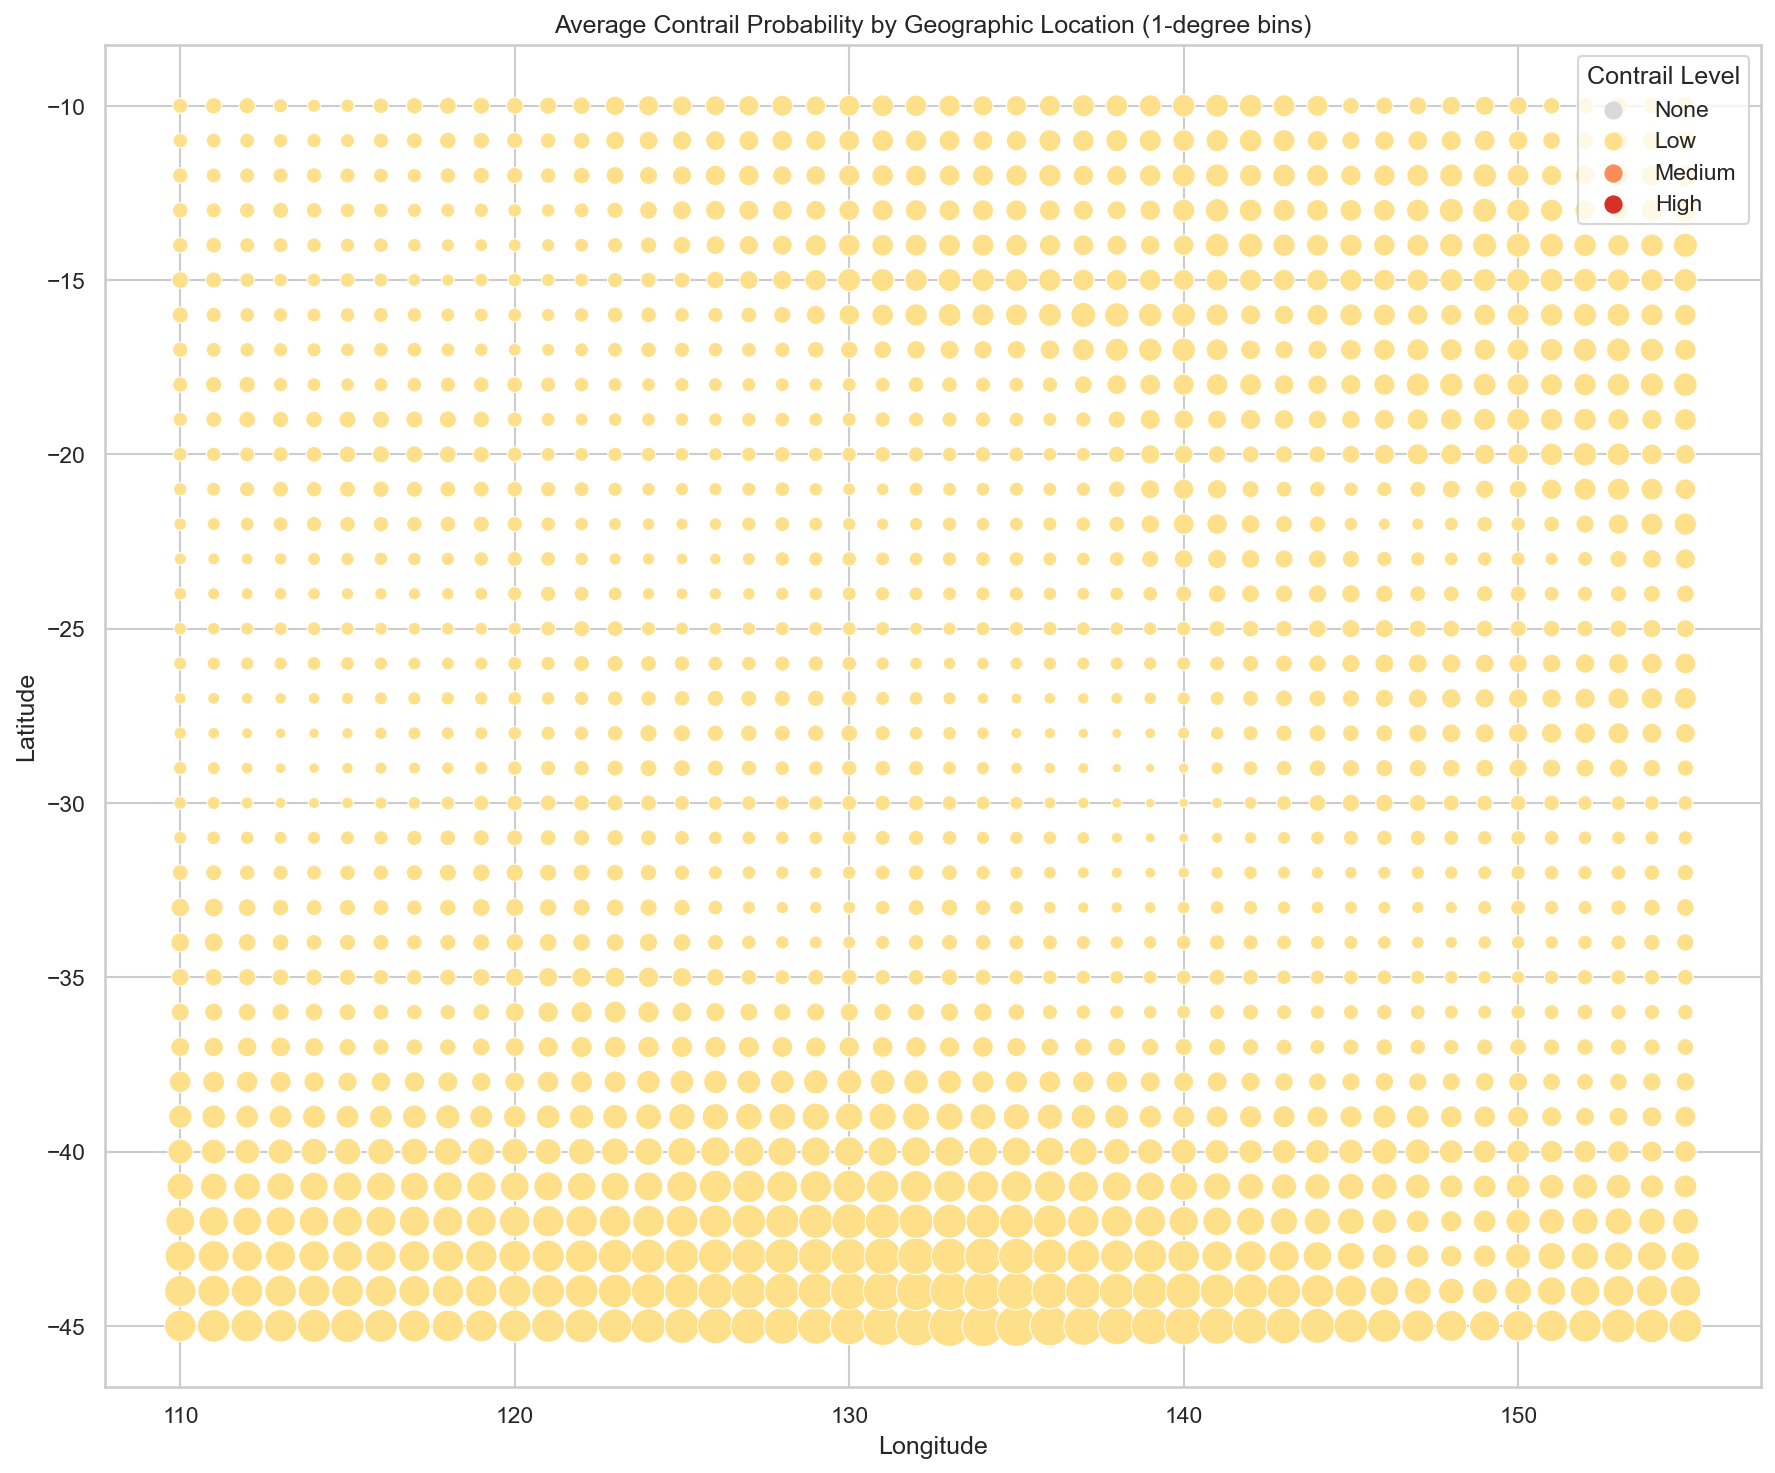
Entry 1: Kickstarting My Project
Setting up the Google Contrails API and importing a week of data with an initial look at hourly trends, flight levels, and geographic distribution of contrail forcing index.
subscribe via RSS