Entry 3: Contrails with Respect to Latitude, Altitude and Time
In Entry 2, I looked at where contrails form and at what altitudes in Australia during winter months.
I saw that the contrail forcing index was significantly higher over the Southern Ocean (area from Australia’s southern coast to Antarctica) which was interesting given the little aviation traffic there. However, it is important to keep in mind that the dataset only indicates the contrail forcing index and does not indicate whether any aircraft flew there.
In this post, I will re-examine these plots, but see if I can gain further insight by breaking the plots down in terms of latitude, flight level and time of day.
Please note that the below plots refer to the CFI as “probability” and could not be regenerated to update the accurate naming because the data was originally stored in a local database.
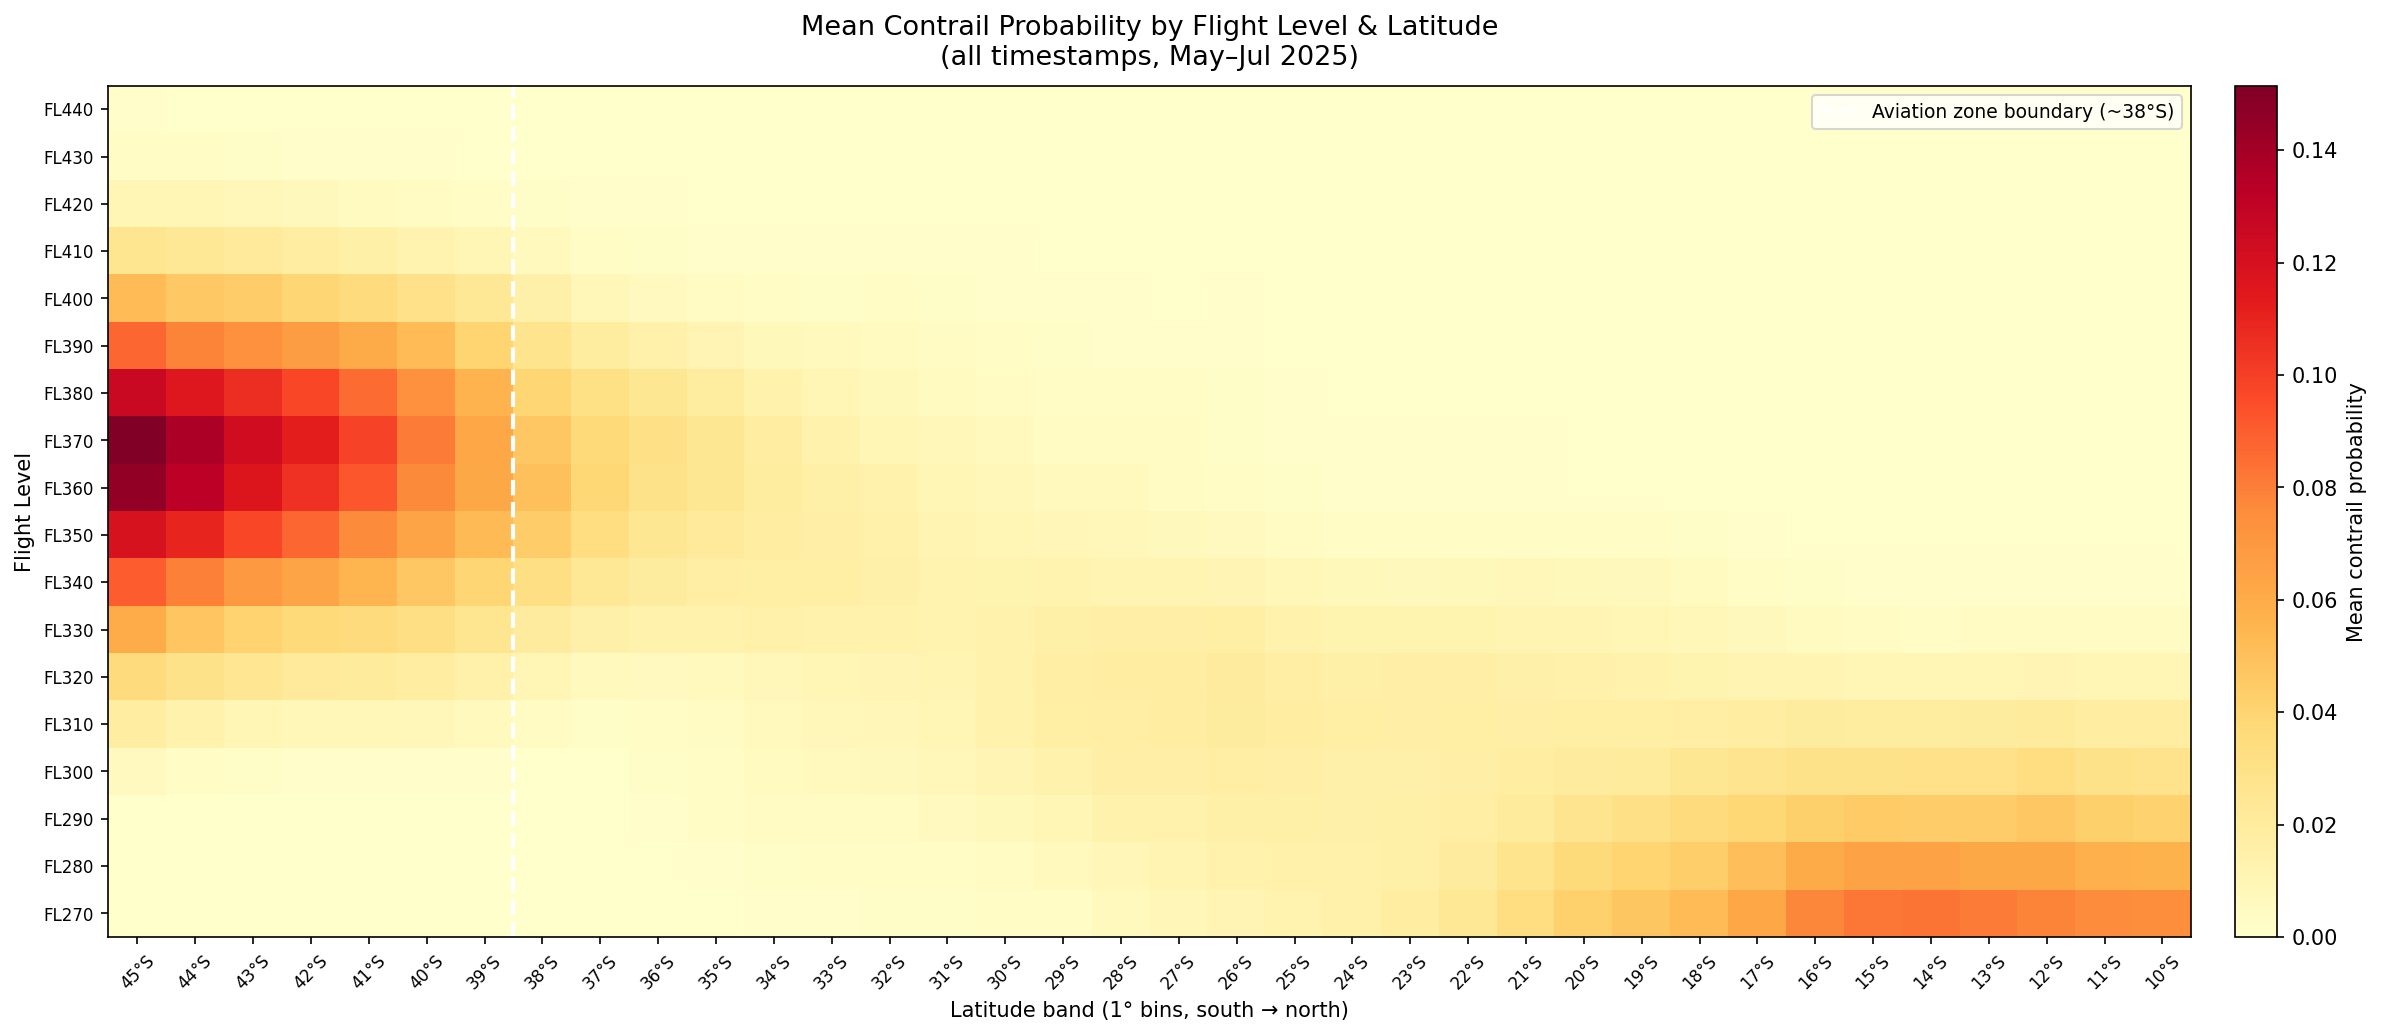
Plots 1 and 2 are heatmaps which aggregate the data to compare Mean Contrail Forcing Index and Contrail Frequency (created in Entry 2) against latitude values. The following table gives some context on latitude values:
| Latitude | Geography |
|---|---|
| 45°S | Deep Southern Ocean — no land, no flights |
| 43°S | Southern Tasmania (Hobart) |
| 38°S | Southern Victoria coast — aviation zone boundary (dashed white line) |
| 35°S | Sydney / Canberra |
| 32°S | Perth |
| 27°S | Brisbane |
| 25°S | Tropic of Capricorn boundary — transition to tropical atmosphere |
| 23°S | Alice Springs |
| 17°S | Darwin / north Kimberley |
| 10°S | Northern edge of the data domain, above Cape York |
Plot 1: Mean Contrail Forcing Index by Flight Level & Latitude
Plot 2: Contrail Frequency by Flight Level & Latitude
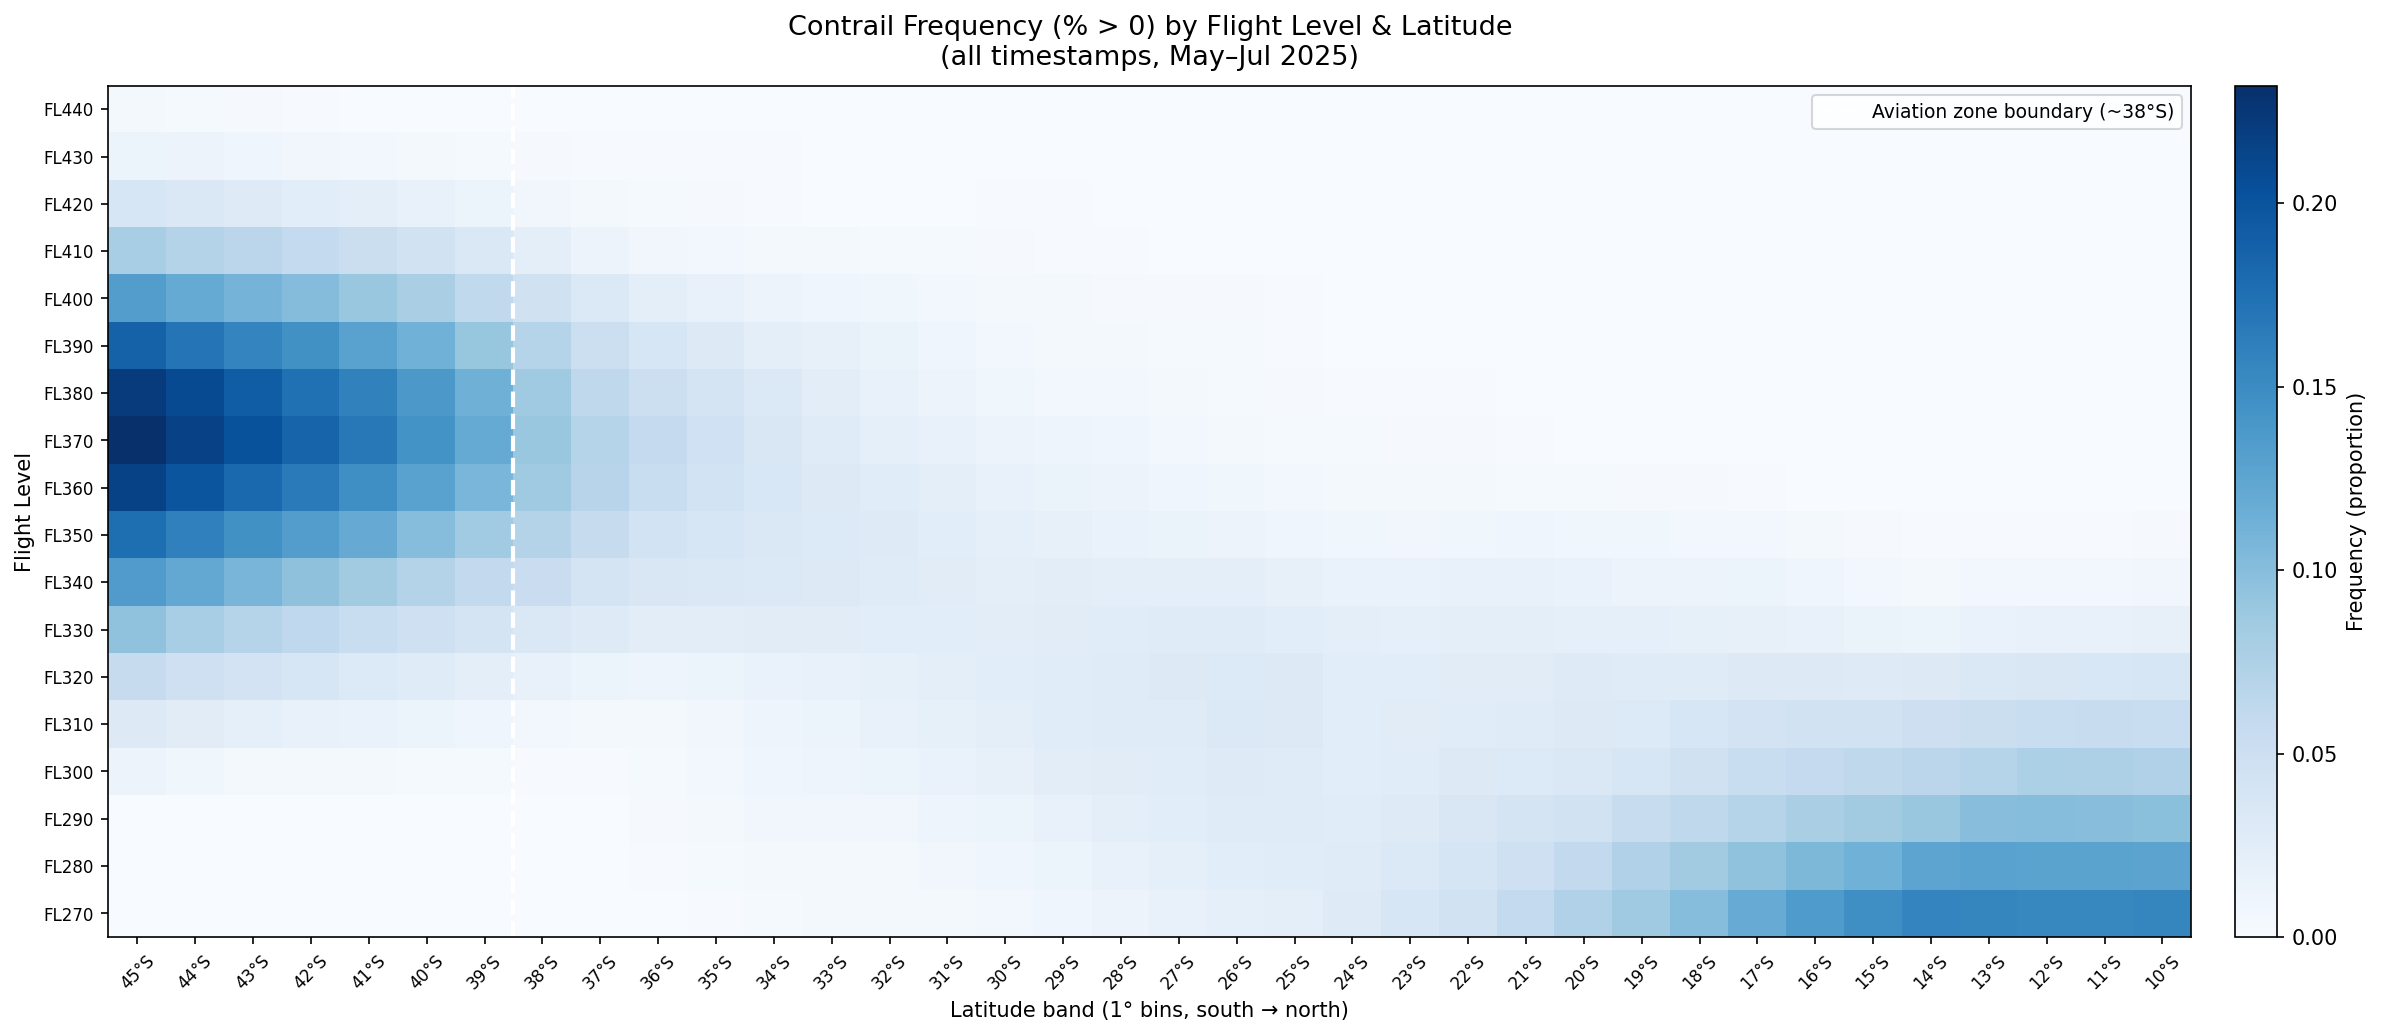
Plots 1-2 give some helpful insight by adding flight altitudes in addition to location. It appears that as you move north, the contrail-favourable layer is at higher altitudes. For example, at southern latitudes, we have a peak CFI of 0.13-0.15 at FL330–FL350, at mid latitudes, the peak shifts slightly to FL340-360, and in the tropical north, the contrail favourable layer appears at FL380-FL440.
In addition to altitudes, I can also look at how the time of day may change the level of contrail risk:
Plot 3: Overall Diurnal Signal
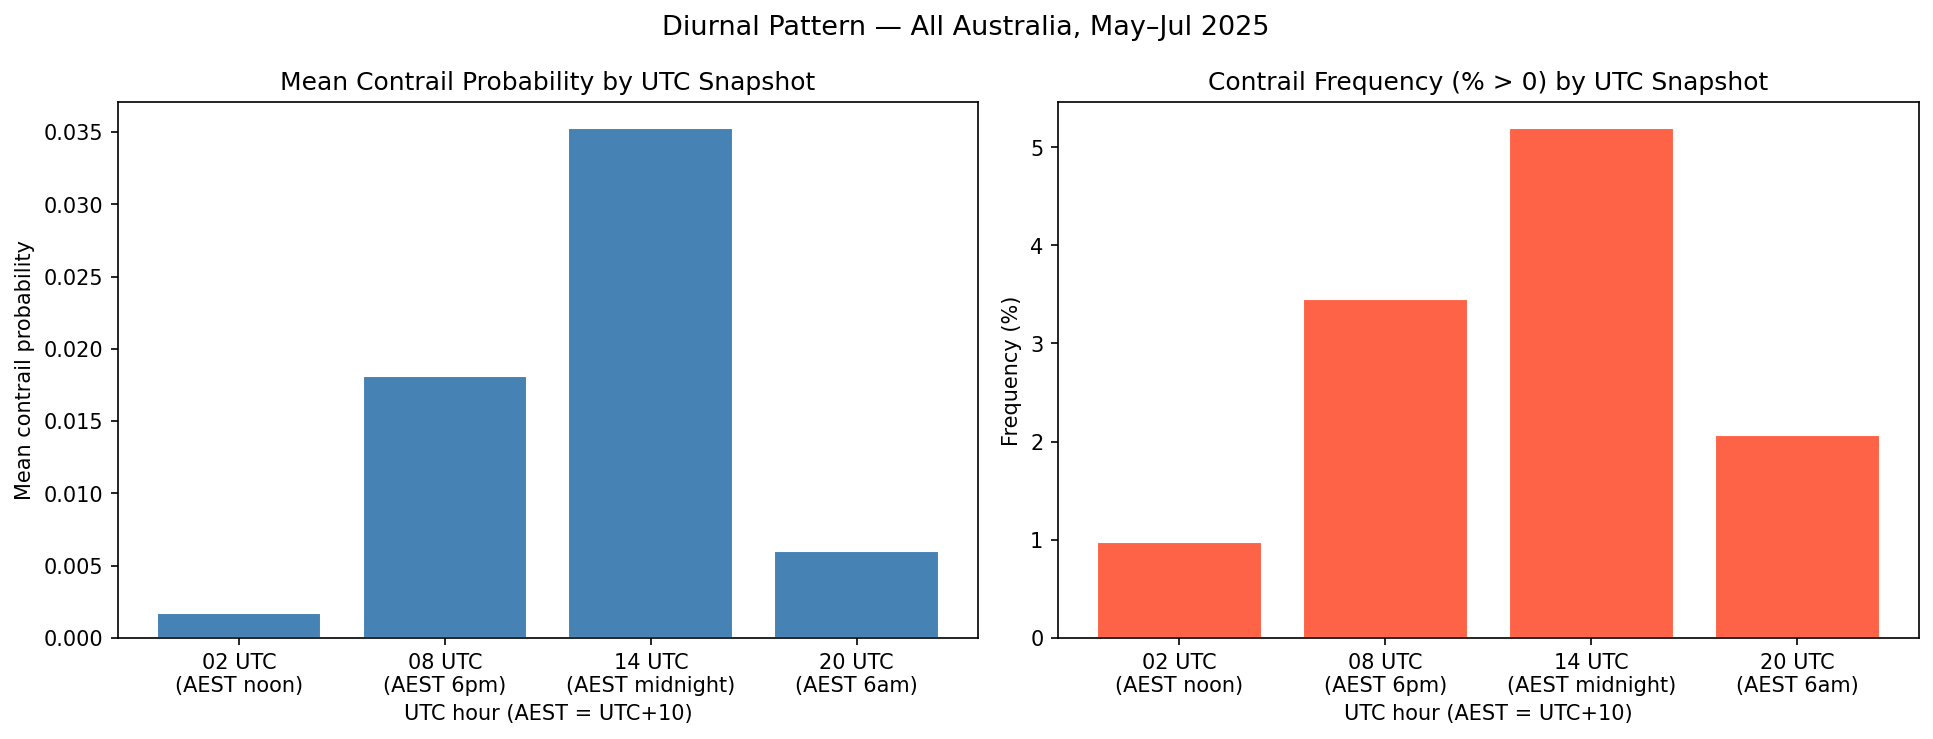
As can be seen above, there are noticeable differences in the bar plots so conditions are not uniform in time, with contrail forcing index highest at around 14 UTC, which is around 00:00 AEST (midnight).
Plot 4: Diurnal Signal by Latitude Band
I can also further examine the results of this bar plot by splitting it into different latitudes as discussed above:
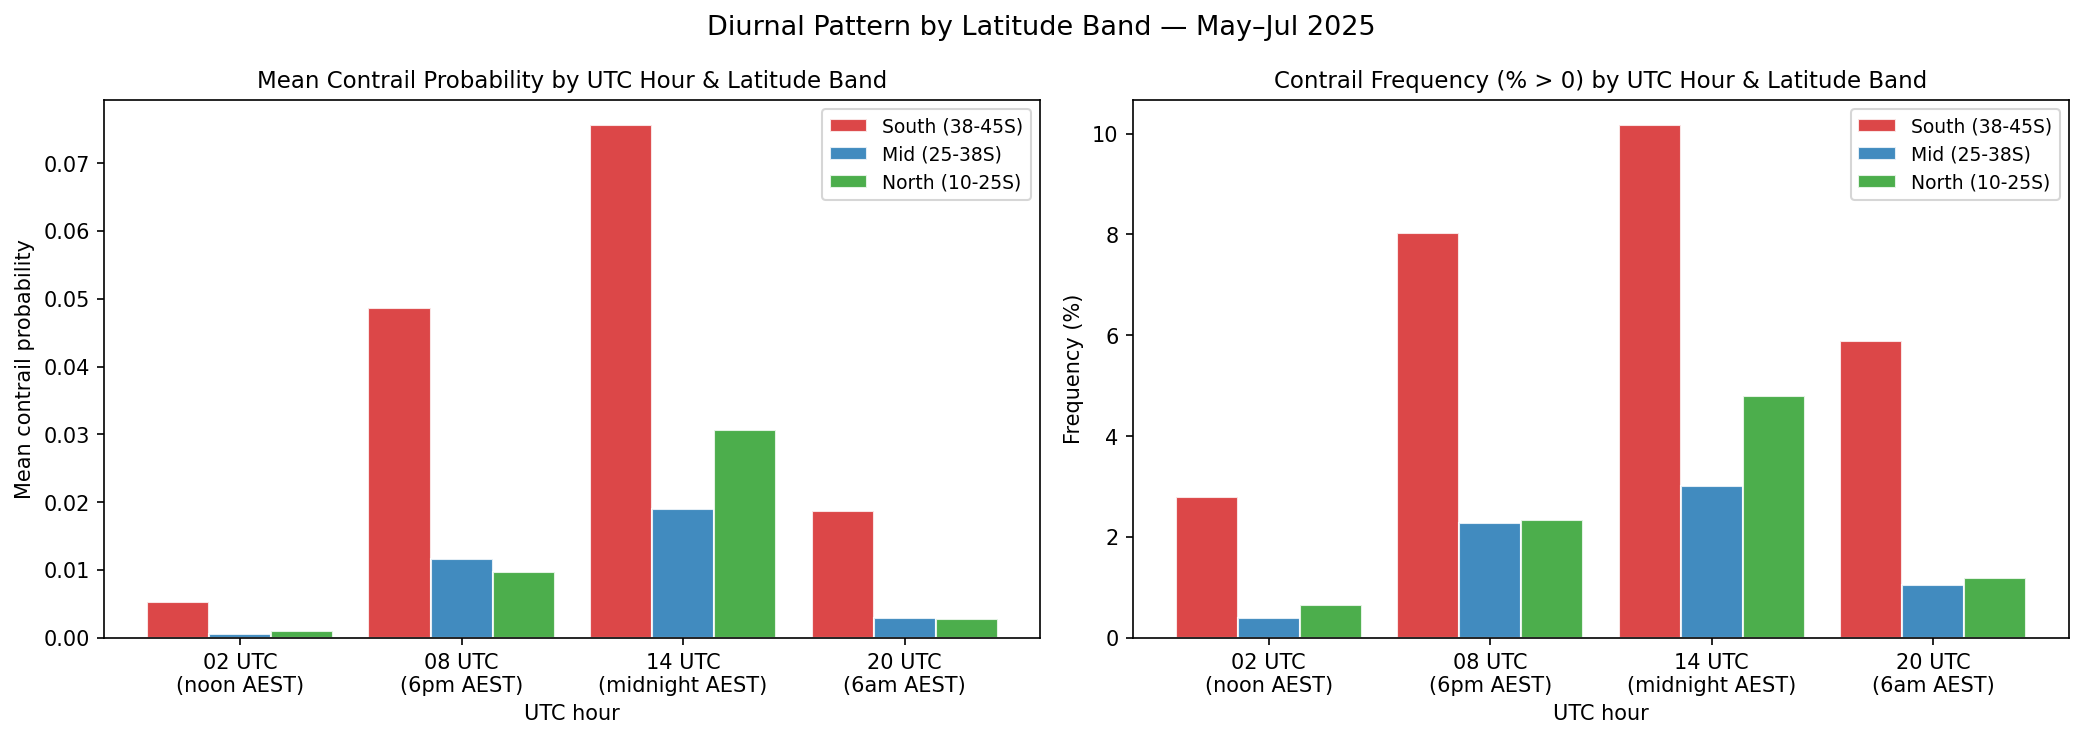
Both plots reveal 14 UTC (midnight AEST) to be the peak, with the Southern Ocean band dominating by 3-7x at every UTC hour, and with 02 UTC (Noon AEST) as the trough.
The main takeaway
From what I have, I observed that contrail formation conditions are the highest overnight and lowest around midday. How does this compare to what is mentioned online?
It was found that the season with the highest amount of contrails is winter in a study taken in the Northern Hemisphere1, which is when this dataset was recorded. Early morning flights tend to create “cooling contrails”, while evening and night flights produce contrails with the highest warming contribution.2 This demonstrates how contrail formation conditions do not necessarily equate to high amounts of warming.
References
[1] Stuber, N., Forster, P., Rädel, G., et al. (2006). The importance of the diurnal and annual cycle of air traffic for contrail radiative forcing. Nature, 441, 864–867.
[2] Transport & Environment — Contrail Avoidance