Entry 5: Adding in Flight Data
In previous posts, we looked purely at contrail formation index based on altitude and coordinates. In this post, we’re going to add a flight traffic layer to move from “where do contrails form” to “where do contrails form where there is also high air traffic?”.
The data needed to find this out is ADS-B data, which provides insights into flight traffic. To get ADS-B data, I created an account on OpenSky. However, a standard account restricts queries to the last hour and I need researcher access to match the May-Jul 2025 window that matches the Contrails data timeframe. For now, assuming that flight routes remain largely stable year-round, I can use existing data to get some insights. Using this, I got four insightful plots.
Plot 1: Overlay: Flight Corridors on Contrail Risk Background
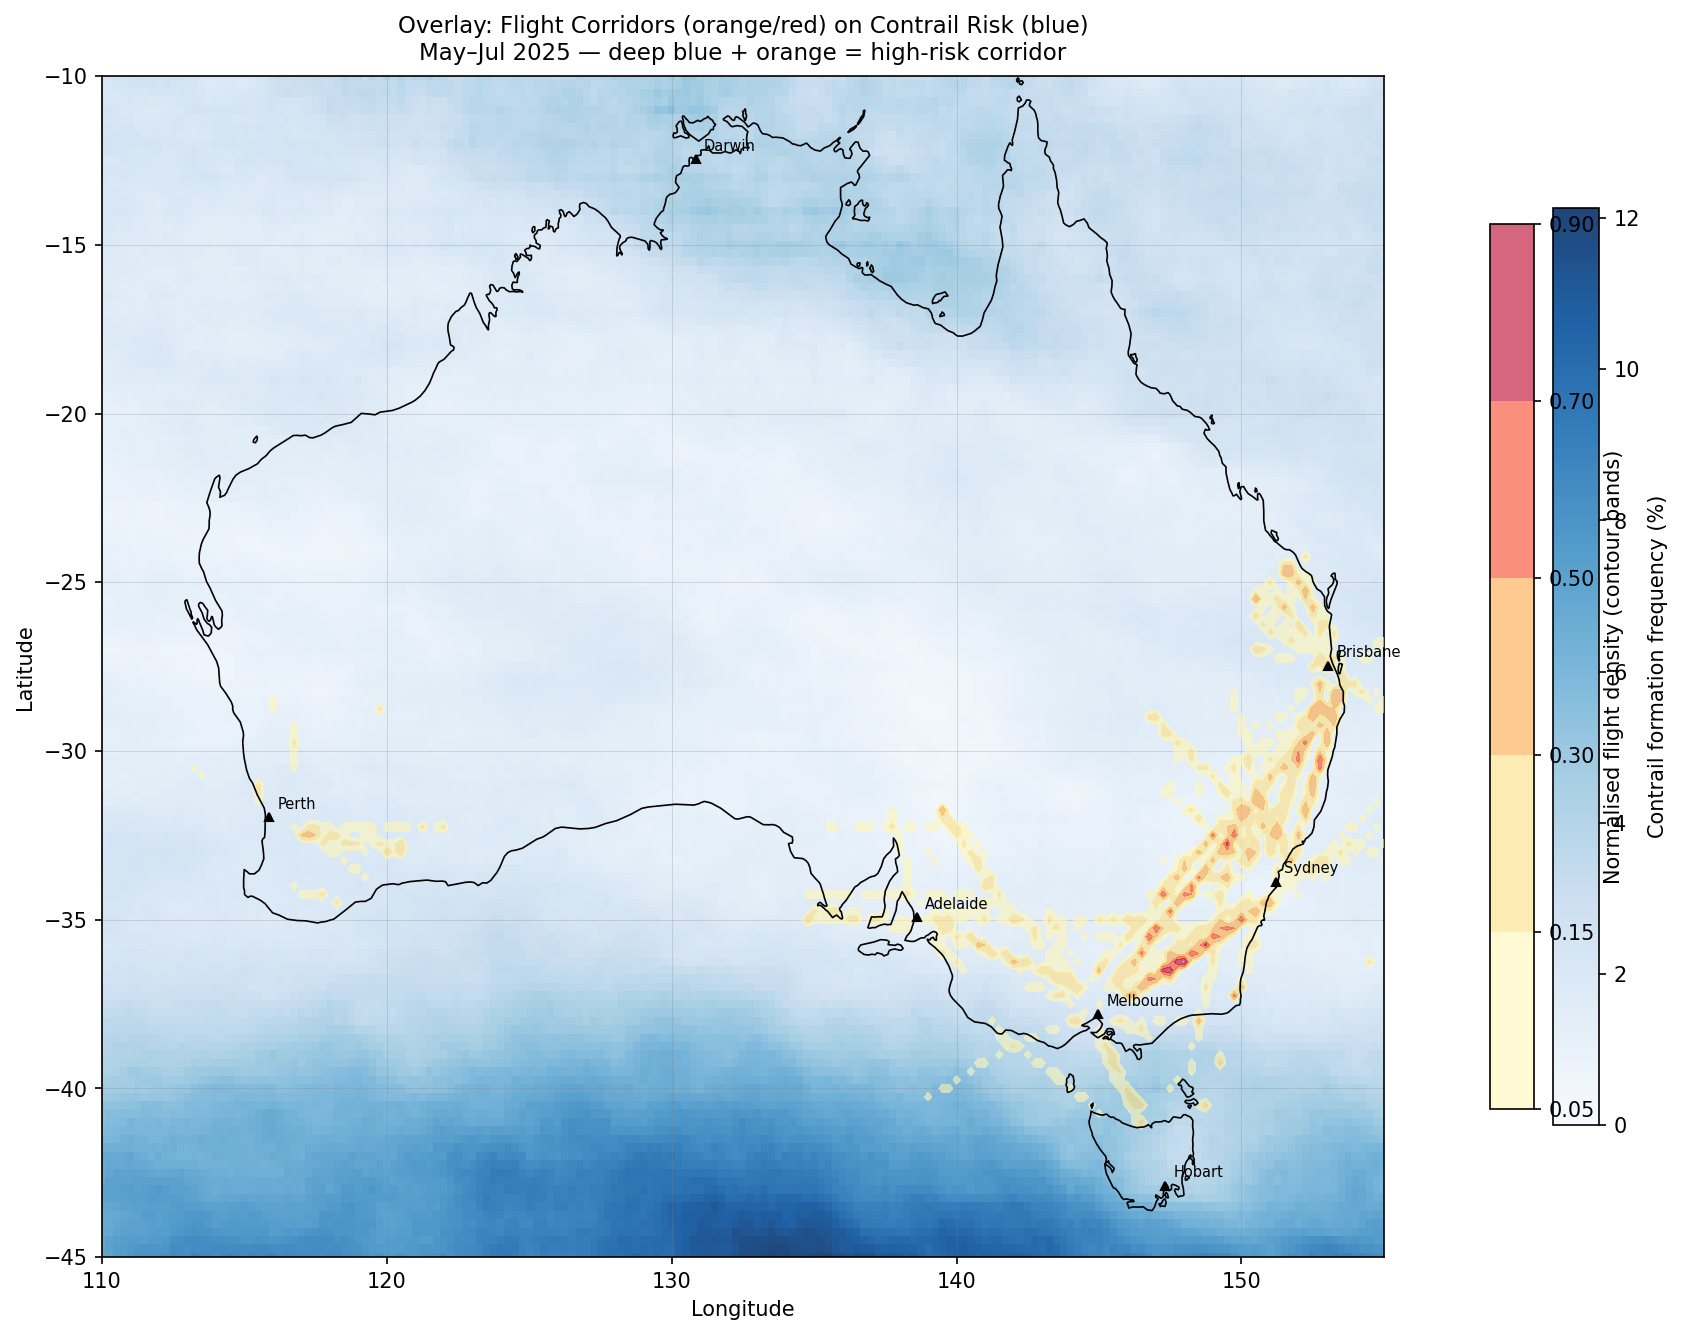
As seen above, flight density is highest on the east coast connecting the cities Brisbane, Sydney and Melbourne. Interestingly, Darwin has very little air traffic represented, which might be caused by OpenSky receiver gaps in NT. These observations on air traffic contrast with the highest contrail formation probabilities, which are concentrated in the Southern ocean. The only place of overlap is in the Bass Strait (between Melbourne and Tasmania) which has a reasonable amount of traffic but not as significant as between the three cities mentioned above.
The main takeaway from all of this is that Australia’s busiest flight paths are not where contrail formation is most likely to happen, at least based on the current dataset collected in winter 2025. Even if we were to predict flight levels to avoid contrail-likely zones, this would not affect the busiest flight corridors in Australia.
Plot 2: Exposure Index: Where Avoidance Would Matter Most
This plot provides an indicator of prioritisation for avoidance effort. Each grid cell is scored as: exposure = normalised_flight_density × normalised_contrail_frequency. Dark orange/red = busy AND risky.
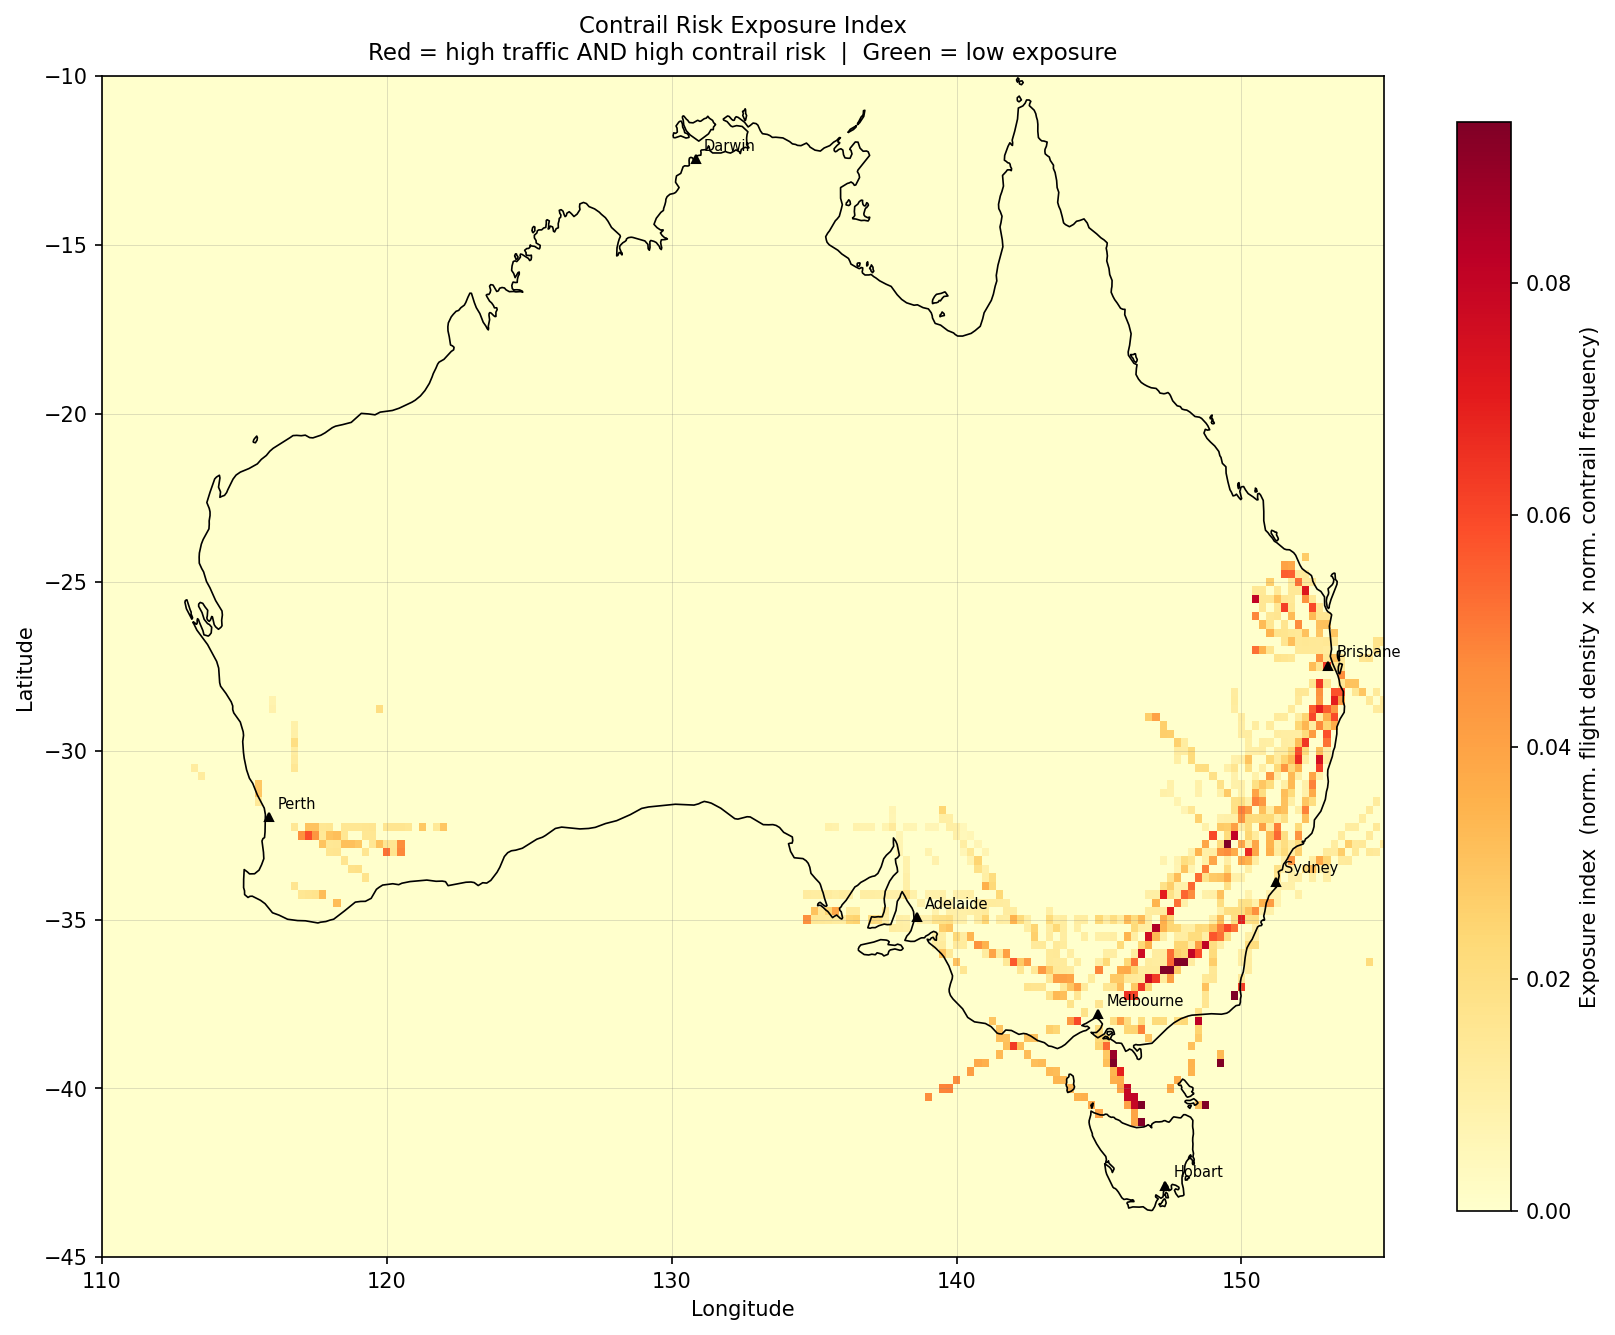
This presents some interesting results where the two (contrail formation and flight density) might overlap. The peak cell was found at 36.25°S, 148.00°E with an exposure score of 0.123, which is Snowy Mountains / Monaro Tablelands and is a part of the Sydney-Melbourne route, which is the 6th most travelled route worldwide1!
Another cell of interest is 41.00°S, 146.50°E which is over the Bass Strait (flights to and from Tasmania). Its atmospheric risk is around ~3× higher than the NSW tablelands cells but fewer aircraft transit it. Northern Territory is completely blank here. Anecdotally many aircraft pass the NT on overseas flights - perhaps it is a lapse in ADS-B data.
Plot 3: Altitude Alignment: Are Planes at the Riskiest Flight Levels?
The left plot is from last post with the different altitudes distributions shown by contrail forcing index.
The below FL distribution on the right comes from the 20 snapshots of OpenSky data. Each snapshot returns real-time state vector data for every transponder visible to ground receivers. One of these quantities is barometric altitude in metres, which was converted here to ft.
To define whether the track was airborne or not, used these two variables: on_ground == False and FL ≥ 200. There is nothing that identifies a climb or descent, so the distribution is more “where aircraft were observed” rather than cruising altitude.
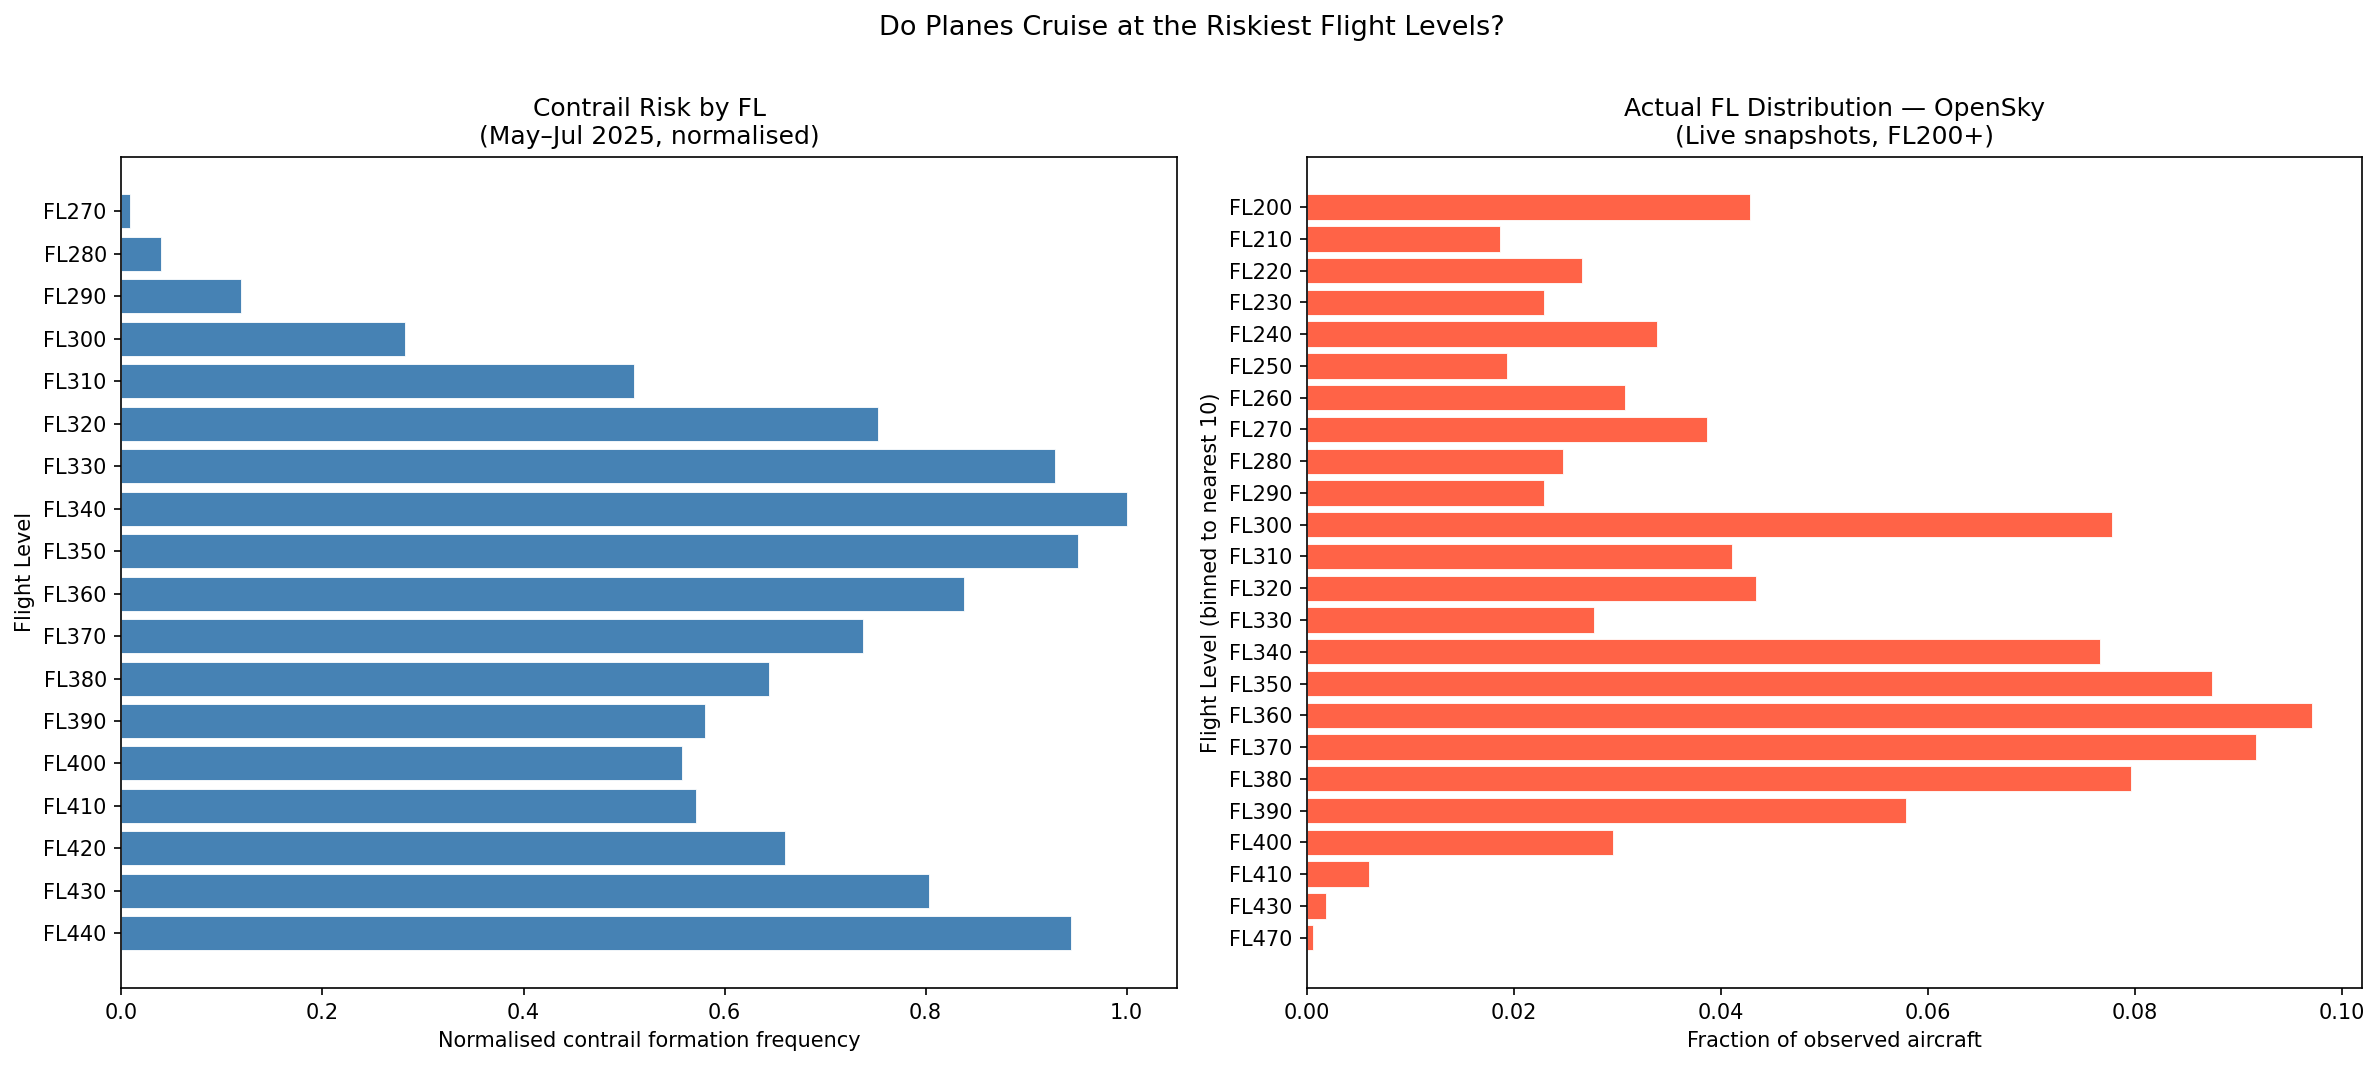
An observation that can be made from above is that around 93.6% of flights are observed at FL320-FL400. Even though the data is limited to 20 snapshots observed on one morning in March, aircraft cruise at certain altitudes by design, so our observations here can provide some useful indication of cruising altitude for further research while waiting for more ADSB data.
In earlier posts, it was observed that FL340-FL360 is where contrail risk peaks for mid-latitudes. The above right plot shows that commercial flights observed concentrate in the FL340-390 band, which has some overlap. This is significant because it relates to the potential need for changes to altitude as mentioned on Google.
Main Takeaway
For the most part, there is little overlap seen here between air traffic and contrail forcing index. However, it is valuable to note the Bass Strait as one area of interest for further study on this topic.
At the same time, it is important to note that the data used captures a small snapshot of time and the ADSB data is even more limited, not accounting for areas such as the NT, which may potentially yield interesting results. In addition to the Bass Strait, I want to repeat the same analysis for other time periods and use more extensive data to get more insights.
References
[1] OAG (2025). Busiest Routes in the World 2025.