Entry 6: Charting Australia’s Domestic Skies
Last post, I used a very limited amount of ADS-B data to get a glimpse into how contrail formation in winter intersects with air traffic inside Australia. Despite how limited the ADSB data was, it showed how contrail formation likelihood may not align directly with where the air traffic is, and identified the Bass Strait as a region to be investigated further, where there was a reasonable amount of air traffic and contrail forcing index.
OpenSky’s free tier ran out of credits quite fast, so I decided to use a Github Action to collect a snapshot of Australian airspace every 15 minutes. It will take a week to collect a good amount of data, so this post is what I am doing while waiting for that.
In Australia, BITRE (Bureau of Infrastructure, Transport and Regional Economics) provides a free, downloadable dataset of monthly domestic aviation statistics with the total number of flights and seats for that month. In today’s post, I plan to look at domestic flight routes, particularly the busiest ones, and evaluate them with the contrail risk data.
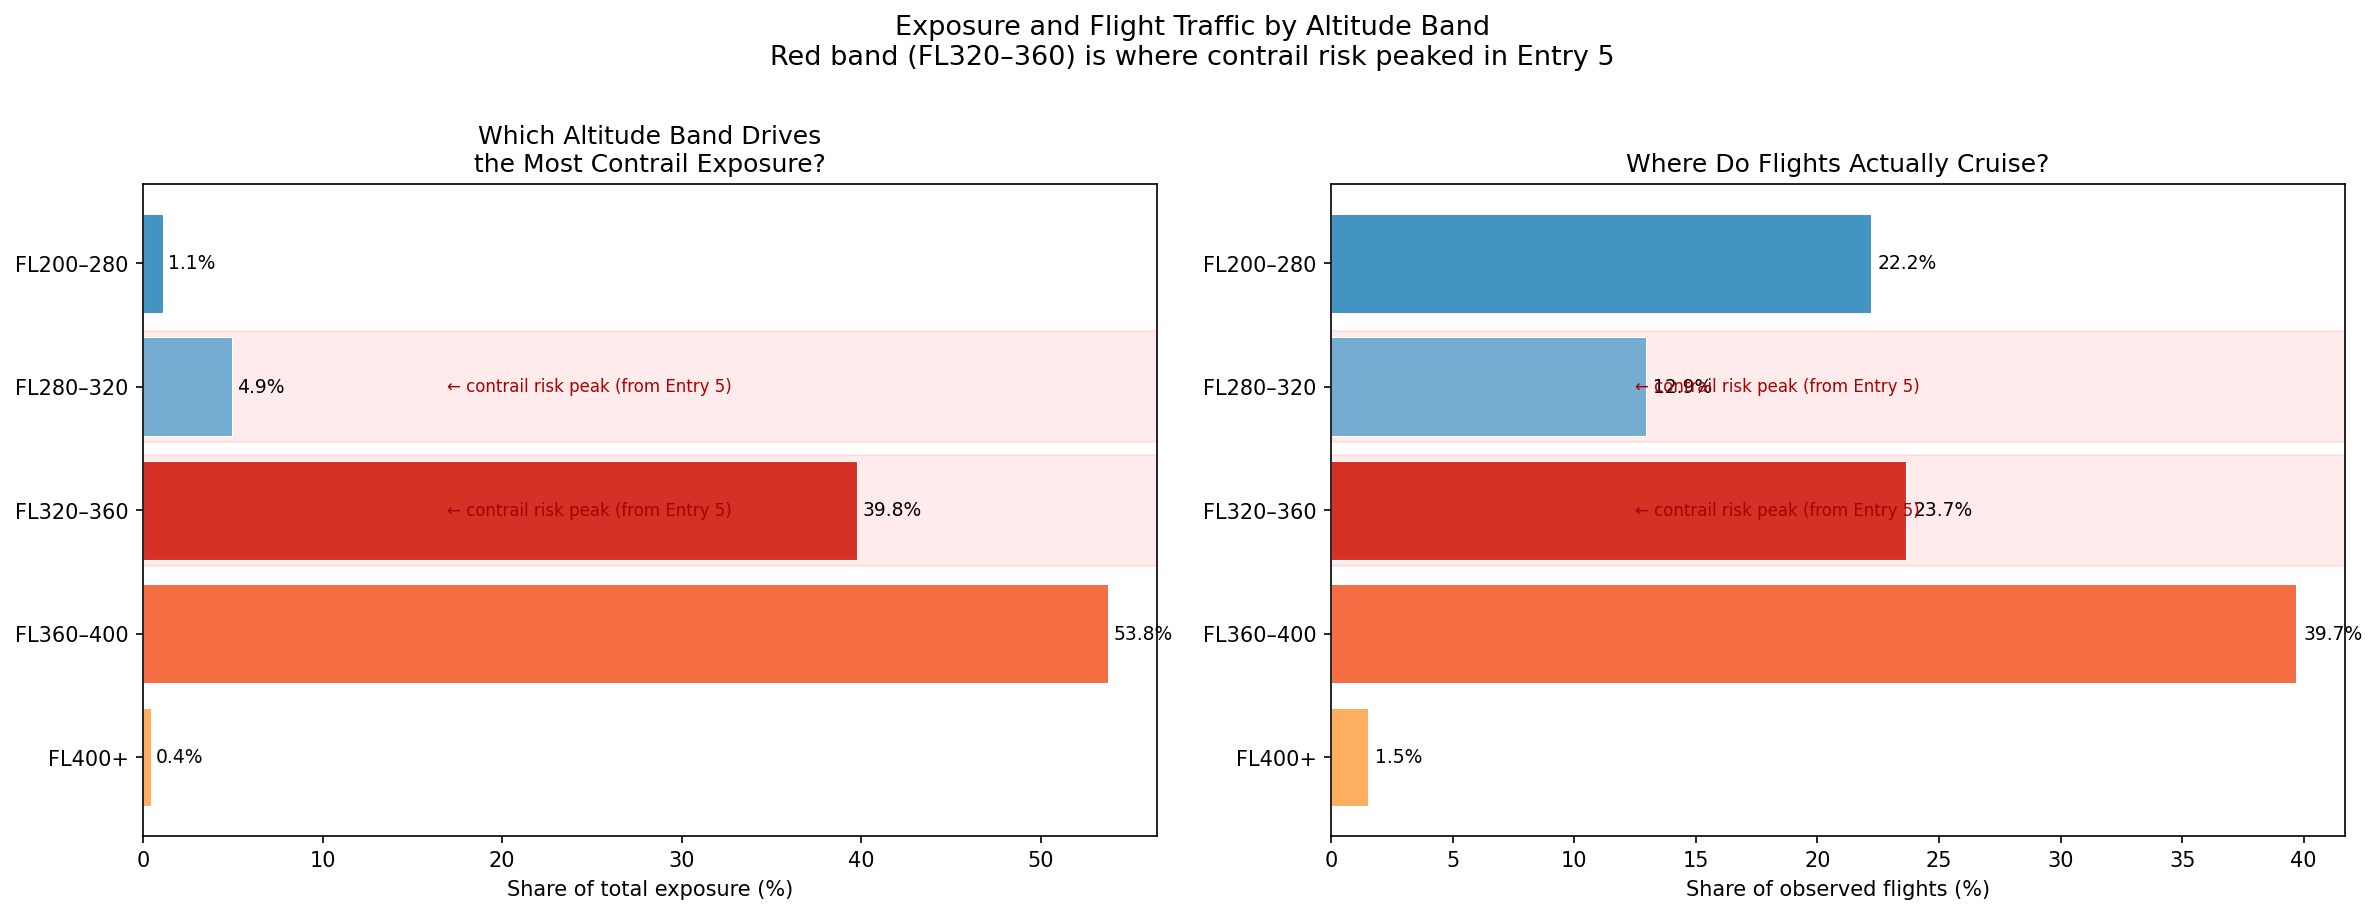
Entry 5 found from some limited OpenSky data that flights were observed to mostly be at FL320–FL400 in Australian skies. A quick search online at flight reports shows a cruising altitude from SYD-MEL ranging from FL330 to FL400.
How this analysis was done
Transparent Sheet: Used 28km squares over a map of Australia and coloured each square by how often the atmosphere at cruising altitude (FL320-400) contains the conditions for contrails to form and persist. Dark squares indicate where the atmosphere is prone to contrail formation.
Great Circle Paths: on a globe, the shortest path between two points is a slight curve known as a “great circle”. For short routes that curve is almost identical to a straight line on a flat map, while for longer routes it arcs more noticeably. I go along each great circle and record which grid squares it passes through, treating the whole route as if it were at cruise, which may overstate the exposure at airports where planes would be climbing or descending.
The BITRE dataset: Contains monthly domestic aviation statistics with every city pair in Australia. We downloaded all 12 months of 2024 and added them up to get annual flight counts. For each route, multiplied contrail risk along the great circle path by the annual flight count resulting in a total annual exposure score that indicates how contrail-forming the route’s geography is with its flying frequency.
In summary, our dataset looks like this:
| Source | Detail |
|---|---|
| Contrail risk grid | Uses 2 models: ML-based model and Contrail Cirrus Prediction (CoCiP), FL320–FL400, May–July 2025, 239 timestamps, 25,521 grid cells at 0.25° resolution |
| Flight traffic | BITRE monthly domestic aviation statistics, all 12 months of 2024, 62 city pairs with known airport coordinates |
| Path model | Great circle arcs sampled at 150 points; assumes all points to be at cruise altitude (within Australian bounding box) |
Note there are some limitations. First, great circle paths are not exact. Second, BITRE provides a seats-per-flights figure which we can assume aircraft size. For flights with low passenger size, they are likely to be operated by turboprops which have a much lower cruising altitude. This causes the exposure score to overstate actual contrail risk, which is important to keep in mind.
Routes vs Contrail Risk
The top 20 routes by total annual exposure over the contrail risk grid. Arc colour indicates exposure score, with dark red being high and thickness indicates flight frequency.
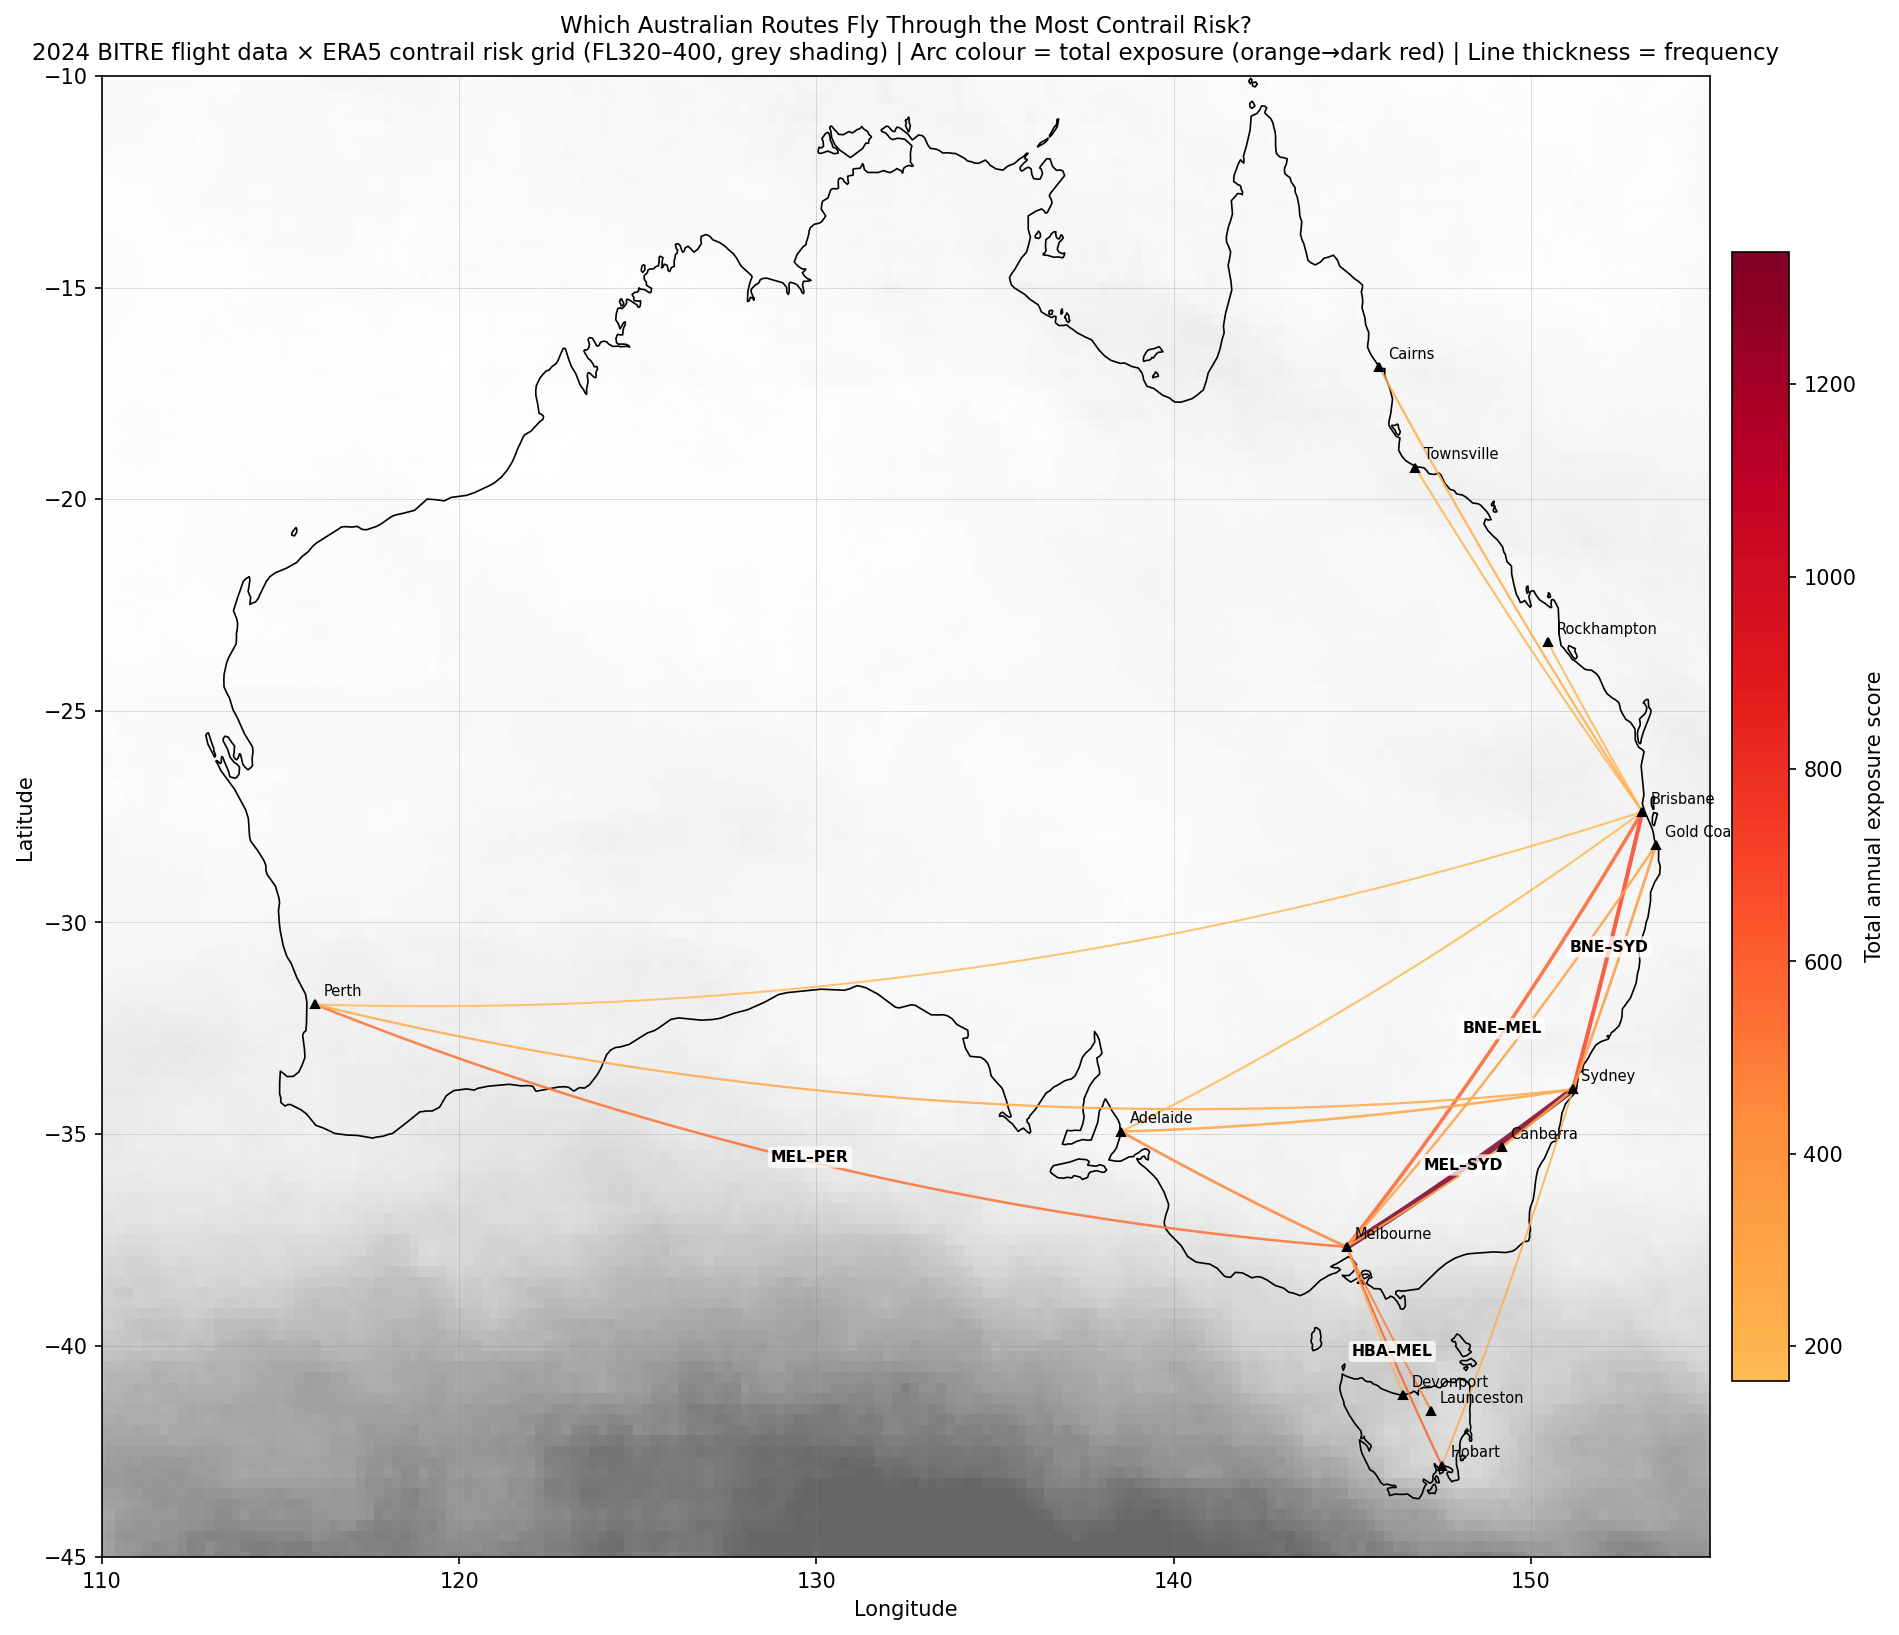
The map reveals that almost all the action is focused on southeastern Australia and the Bass Strait/Tasmania corridor. Northern Territory is largely unlit because the atmosphere there is low-risk relatively as indicated by the white shading compared to the South. The SYD-MEL route as expected is visually dominant due to high air traffic but HBA-MEL stands out because the route crosses through the highest-risk cells in the entire dataset.
Busy Routes vs Risky Zones
Left: top 15 routes by total annual exposure. Right: top 15 routes by exposure per flight (frequency taken out of the equation).
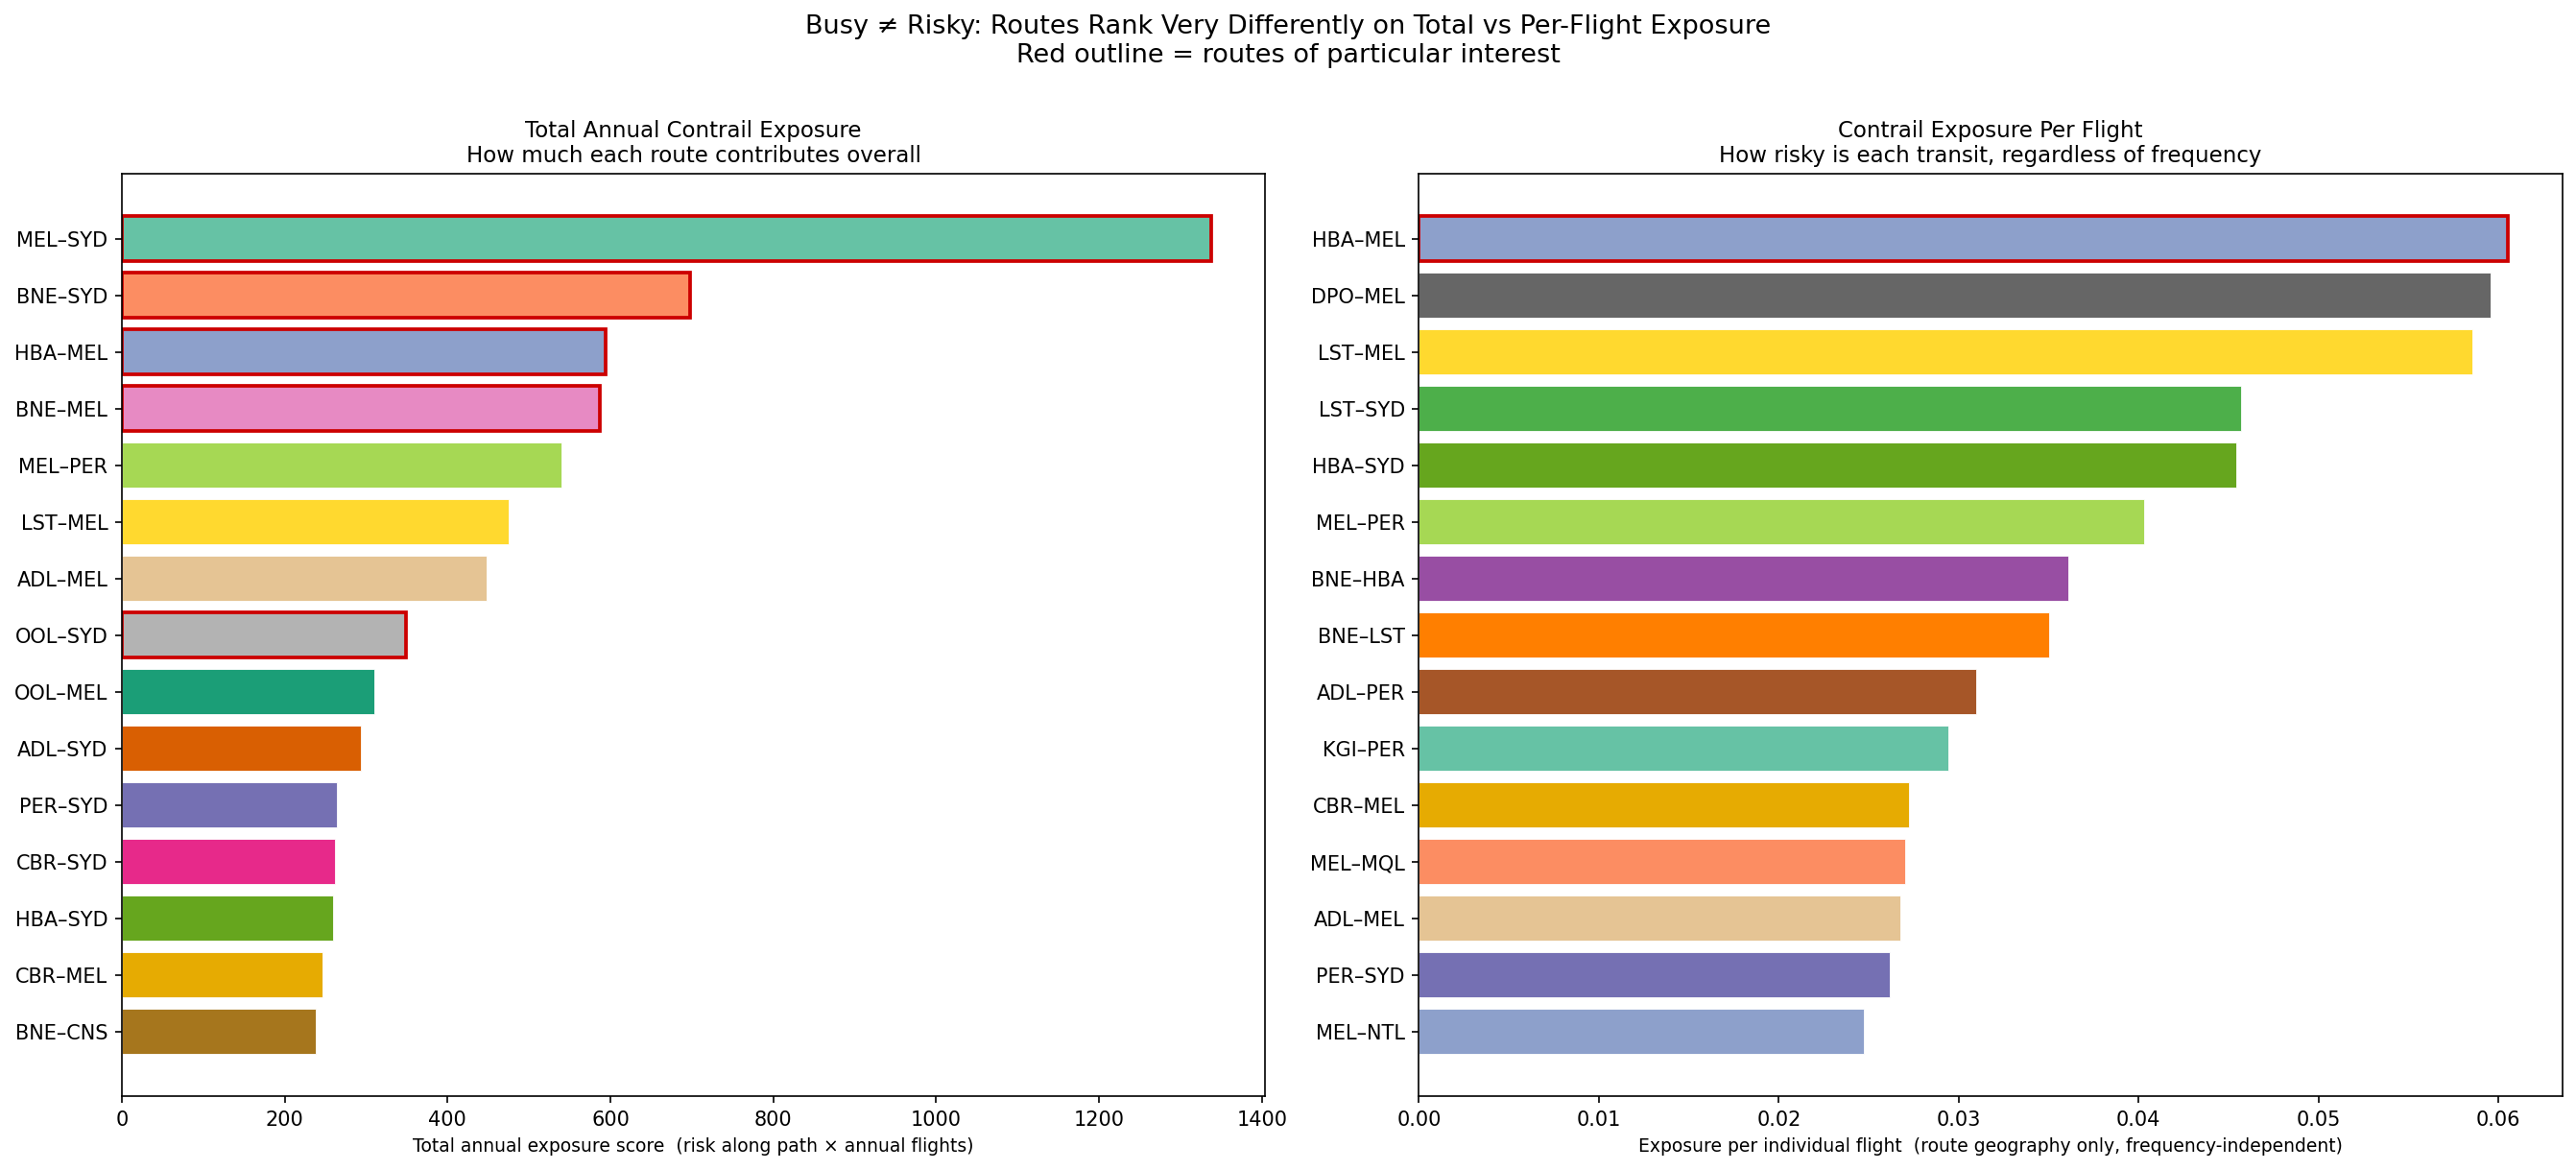
The Melbourne to Sydney route is Australia’s biggest contrail contributor overall with an exposure score of 1,337 and 55,624 flights in 2024. On the right plot however it can be seen that its per flight score puts it around 8th. So it’s not necessarily a contrail-prone route, but given that it is one of the busiest domestic routes in the world, it accumulates more exposure than any other route.
Hobart to Melbourne is the most contrail-prone route per individual flight with a per-flight risk score of 0.0605, which is 2.5x higher than SYD-MEL’s 0.024. Each HBA-MEL flight crosses the Bass Strait on a path that runs almost directly over the cluster of highest-risk cells seen in previous posts. It ranks 3rd in total exposure despite carrying only around a sixth of SYD-MEL’s traffic.
What Factors Determine Contrail Exposure?
To look into this question, 3 scatter plots were generated examining the roles of frequency, seats per flight (aircraft size) and route distance.
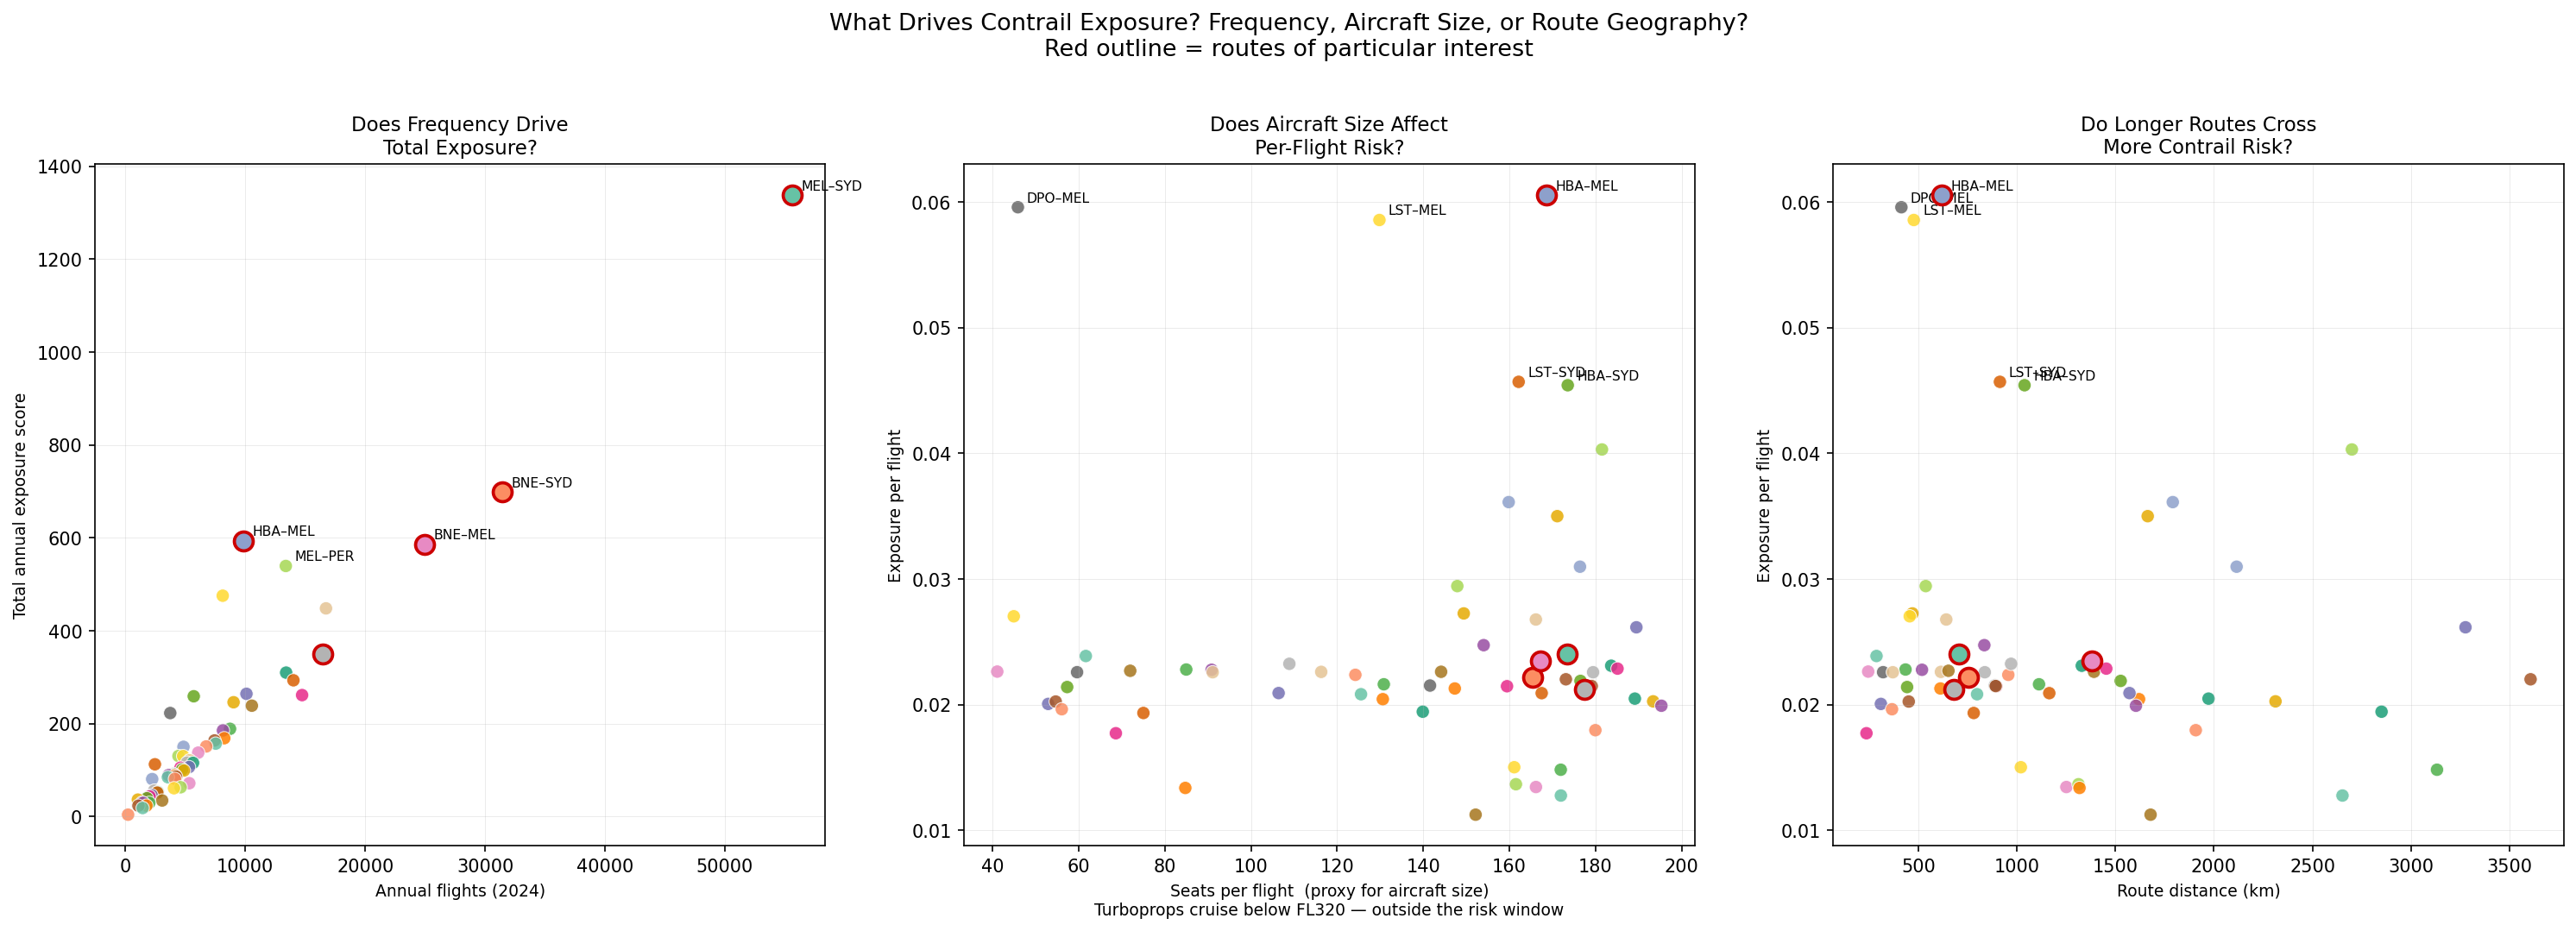
Plot 1 shows a strong correlation between annual flight count and total exposure. This matches what we saw with SYD-MEL flights where when a route is flown more often, total exposure accumulates. However, this relationship is not purely linear, with an example being HBA-MEL which sits above the trend line because the per-flight risk is so much higher than average.
In Plot 2, as mentioned earlier, routes with few seats (<70) tend to be turboprop planes which results in some scattered results because they actually fly at much lower altitudes below the risk window. The highest per-flight scorers all have 100+ seats, which indicates that they are jet-operated routes. Routes like DPO-MEL score high in exposure but have low seat numbers per flight (turboprop) so the high score reflects Bass Strait geography rather than a real contrail exposure.
Plot 3 shows a weak positive trend between route distance and per-flight risk. The per-flight risk score is calculated by averaging the risk of squares a route crosses, so the distance of the route doesn’t cause risk to increase, what matters more is the skies the route passes through. For example, routes to Perth are long but have a moderate per-flight risk as their track crosses the low-risk, arid interior while Tasmanian routes are shorter but score high because every km of their cruise phase is over the Bass Strait risk corridor.
Main Takeaways
While waiting on ADSB data to load, we were able to get some interesting information using BITRE data along with our Contrails and OpenSky data.
With what we have, we can see examples of how contrail formation risk appears in different ways. In some cases, it is high-risk and low-traffic, and in other cases, it can be low-risk and high-traffic.
The ADS-B data, when loaded, will provide more supporting information. Particularly to answer questions such as whether the actual paths match the great circles, or if every flight on the same route hits the same risk cells? Some other considerations for future posts include looking at turboprop flights at lower altitudes, and looking at how data at other times in the year (seasonality) affects things.