Entry 11: Do FIFO flights enter contrail-forming regions?
Now that I was able to filter the ADS-B dataset to WA and label flights as FIFO and non-FIFO, it’s time to join the dataset with the Google Contrails dataset. From this, I want to now see what percentage of flights that are in the “risk region” for contrail formation.
Joining the Dataset
The contrails dataset has coordinates that are rounded to 0.25, so the ADS-B data had to first be rounded so there could be a match. So this was done to the longitude and latitude columns. Flight level was also rounded to the nearest 10 to match the contrails dataset. This was also done for the timestamp column, which in the contrails table only records results for each multiple of 6 (UTC 00, 06, 12, 18), so each result is rounded to one of these four times to match. The ADS-B data was then filtered between FL270 and FL440 as this was the altitude range the Contrails API covers.
Next, the rounded timestamp column was filtered in the ADS-B dataset to make sure it matches the timestamps in the contrails dataset.
Then the rounded matching columns in the ADS-B dataset were renamed to match the contrails dataset and a left merge was performed.
The fillna() command was run on contrails for rows where there was no match, as this indicates a contrail forcing index of zero. A sighting is counted as “at-risk” when CFI > 0.001.
Next, I created a new variable called local_date to convert the timestamp from UTC to Perth time.
Next, I imported the FIFO dataset labeled from last entry and then performed an inner merge to get this merged table to have labeling. This left the resulting table with only Australian airlines, with the FIFO/non-FIFO label attached to every sighting of each flight.
Visualising the Results
I first wanted to see how many of the flights in the dataset that pass through contrail-forming air are FIFO or non-FIFO by percentage.
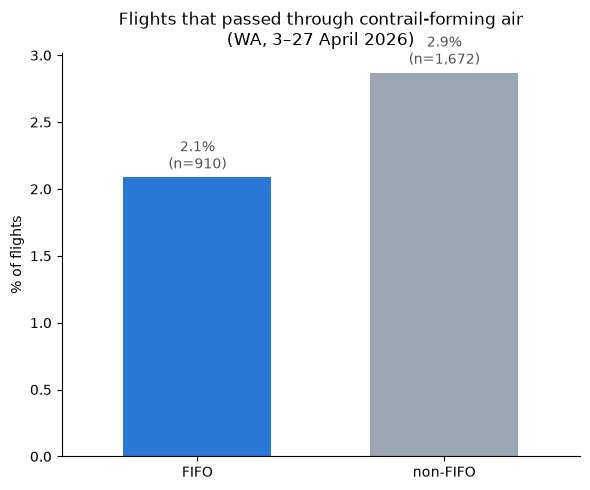
The plot shows the share of non-FIFO and FIFO flights that passed through contrail-forming air (if any of its sightings over WA was in a cell with CFI > 0.001).
This revealed 2.1% of FIFO flights (n = 910) passing through contrail-forming air compared to 2.9% of non-FIFO flights (n = 1672). Considering that 2.1% of 910 is around 19 flights and 2.9% of 1672 is around 48 flights, a two proportion z-test on Jupyter Notebooks using the math module gets a p-value of 0.23, which is not statistically significant and shows that the data doesn’t provide enough evidence of a true difference between the two. So more data is needed to understand this gap.
The next plot shows the altitude distribution among FIFO and non-FIFO flights. The right-hand plot shows when you filter out observations that were rounded to beyond 1 hour of the recorded time (given contrails data) was every 6 hours, this accounts for a big disparity between the observation and time. However, on the other hand, this means a significantly smaller number of observations).
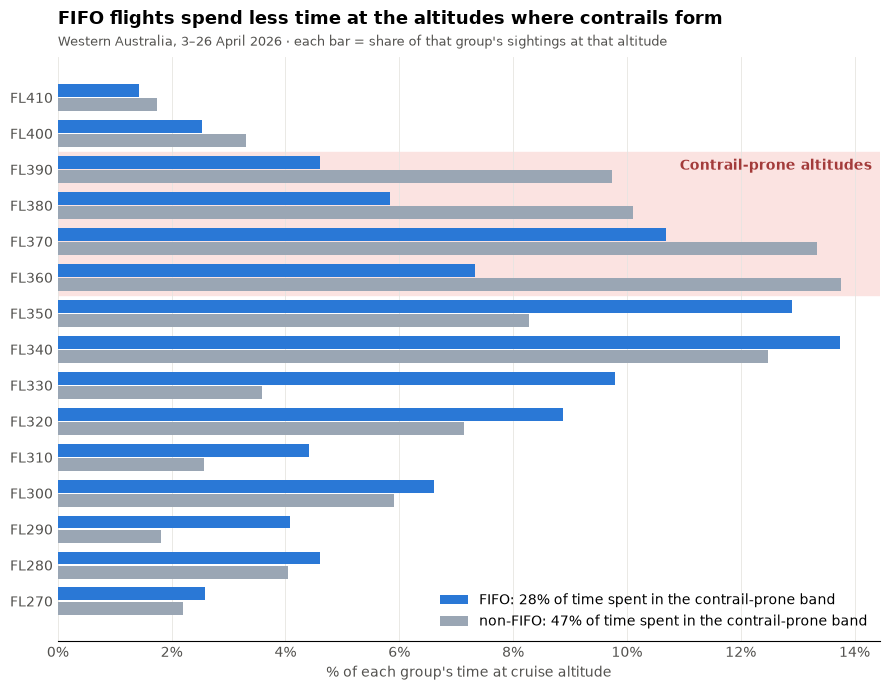
As seen above, non-FIFO flights dominate at altitudes beyond FL340 and contrail-prone altitudes as well. Maybe due to FIFO flights having small aircraft? Let’s verify that.
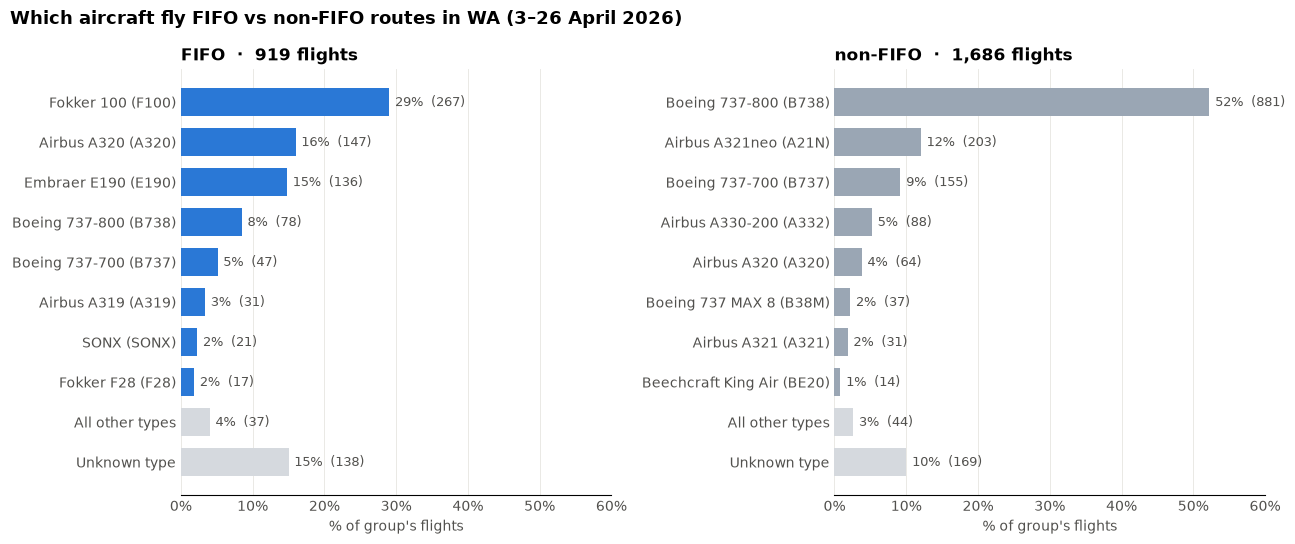
Let’s compare the difference between the cruising altitude of a Fokker 100 with a Boeing 737-800. Fokker 100 has a maximum operating altitude of 35,000 ft1 while Boeing 737-800 has a maximum operating altitude of 41,000 ft2. While the Fokker 100’s maximum altitude is still within the above “contrail-prone” altitude grid, it helps with understanding why FIFO flights may represent a smaller portion of the flights in the region of interest.
Now let’s look at the aircraft distribution amongst FIFO and non-FIFO flights in at-risk regions.
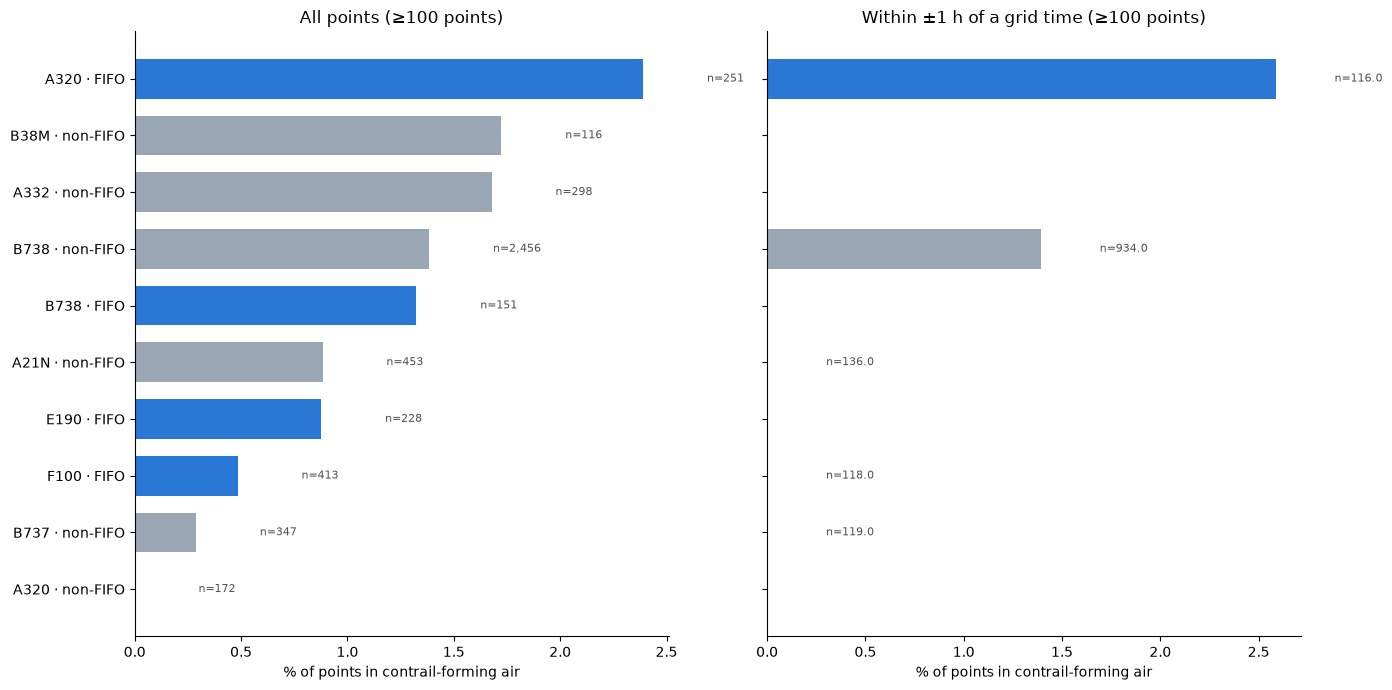
What I find to be interesting here is the big difference in the number of observations between the top and bottom bar of FIFO and non-FIFO, despite being the same aircraft. Also the Boeing 737-MAX at second from top, and then Boeing 737-800 below, is that to do with the increased adoption of MAX aircraft in domestic Australia?
Perhaps this should be taken with some skepticism, however, as the right-hand plot demonstrates that when the data is filtered to within one hour of the observation, it seems that the diversity in aircraft type is significantly reduced, with n = 6136 reduced to n = 2259 meaning that 37% of points were kept.
Concluding Remarks
These findings can take us in many directions. What I am most curious about from today’s results is identifying which FIFO aircraft are responsible for those results in the contrail risk zone. I am guessing that they are those flights in those planes that match the common planes for non-FIFO services, such as Airbus A320s and Boeing 737-800s. From this I wonder: what prompts a FIFO service or charter to be done in a large passenger jet as opposed to a small one? What are those routes? What are the implications of a shift in aircraft operation on the mining industry and the FIFO workforce?
I plan to take a small break from looking at FIFO work to compare this to another region of interest identified in a previous entry: the infamous Sydney-Melbourne route.
References
[1] European Union Aviation Safety Agency (2022). Type-Certificate Data Sheet No. EASA.A.037 for Fokker F28 (Issue 08; F28 Mark 0100 section).
[2] European Union Aviation Safety Agency (2025). Type-Certificate Data Sheet No. IM.A.120 for Boeing 737 (Issue 29; 737 Next Generation sections).