Entry 12: Contrails on the Busy SYD-MEL Route
Today we’re going to look at another region of interest I found earlier that also happens to be the busiest air route in the English speaking world1: Sydney to Melbourne.
Joining the Dataset
The range of the data covers 3-26th April 2026. I repeated the same steps as Entry 11 here, except that the contrails data was filtered for the SYD-MEL flight corridor instead of Western Australia. The corridor was defined as the box with longitude between 144 AND 152 and latitude between -38.5 AND -33 and is expected to also capture flights between other major Australian cities, such as Brisbane-Melbourne, Adelaide-Sydney, as well as international traffic.
Next, I filtered the dataset using the standingdata table to check whether each flight had origin/destination as SYD-MEL or MEL-SYD, or was a multi-stop route that included either of the two. In some cases, the route equivalent could not be found in the merge with standingdata and was labeled as unknown, resulting in the following:
route_group
other      20857
unknown     1913
SYD-MEL     1452
Name: count, dtype: int64
Next, I created a table that labeled a point as a “hit” when CFI > 0.001, with the hit rate representing hits/points * 100. This was separated into SYD-MEL and other flights and unknown, and what percentage of hits each category made.
| Route group | Points | Hits | Share of hits (%) | Hit rate (%) | 95% CI (±) |
|---|---|---|---|---|---|
| SYD-MEL | 1,452 | 34 | 23.13 | 2.34 | 0.78 |
| Other | 20,857 | 107 | 72.79 | 0.51 | 0.10 |
| Unknown | 1,913 | 6 | 4.08 | 0.31 | 0.25 |
The results show a confidence interval (CI) of around 0.8%, so the true hit rate is somewhere between 1.6-3.1%, while for other flights the hit rate is 0.5% with a CI around 0.1%. This is still an approximation, given that this calculation treats each point as independent, when many points in this data come from the same flight, so the real uncertainty is larger.
The 34 “hits” were collected across 4 days, with most of the hits on 22nd April and then 26th April, so it may just reflect weather events across two days rather than the route itself, and more data is needed to confirm this.
Interestingly, 22nd April was also the day that most at-risk observations were seen over Interior WA in Entry 8 which suggests that a large-scale weather event may have occurred affecting both regions at once. Satellite imagery from 22 April can be used in hindsight to verify whether contrails actually formed over both regions that day.
Visualising the Results
I first wanted to visualise how the SYD-MEL route compared to other flights in contrail at-risk regions.
over_under represents whether a group gets more or less “hits” than its share of traffic would predict (share of hits/share of points). A value of 1.0 means the representation is fair, >1 means over-represented and <1 means under-represented.
| Route group | Share of points (%) | Share of hits (%) | Hit rate (%) | over_under |
|---|---|---|---|---|
| SYD-MEL | 5.99 | 23.13 | 2.34 | 3.86 |
| Other | 86.11 | 72.79 | 0.51 | 0.85 |
| Unknown | 7.90 | 4.08 | 0.31 | 0.52 |
SYD-MEL has an over_under rate of around 3.9x showing a clear over-representation of hits in the data. It is strange that SYD-MEL accounts for 6% of the total points given how busy of a route it is, however it is also important to acknowledge that a lot of other domestic and international routes are captured over the same flight corridor. Also, the sightings in this dataset are not independent because they contain many points for the same flight.
On the left, we have the distribution of the “hits” (places where the point was in at-risk zone) amongst the SYD-MEL, other flights and unknown routes. On the right, we have how much of each group’s sightings were “hits”.
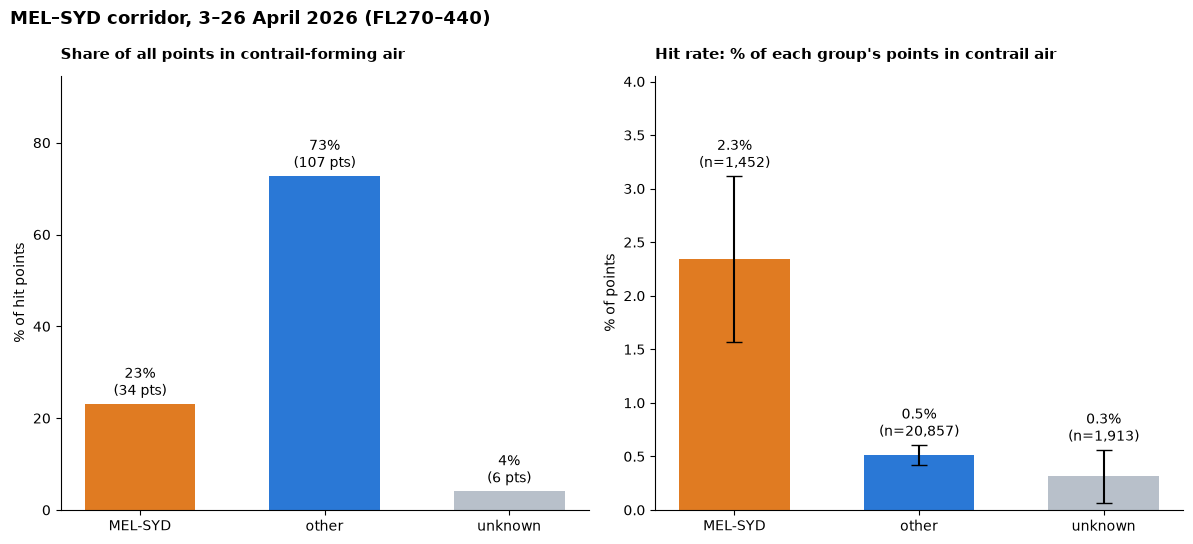
So we can see that on the left plot, “other” flights account for a large portion of the hits. But that’s also expected given that SYD-MEL is one out of many routes in that corridor. On the right however, we can see that the SYD-MEL route has a much higher amount of “hits”. More analysis will need to be done to discover when this occurs. Is it at cruising altitude?
I thought it would be interesting to visually see what all of this looked like on a map.
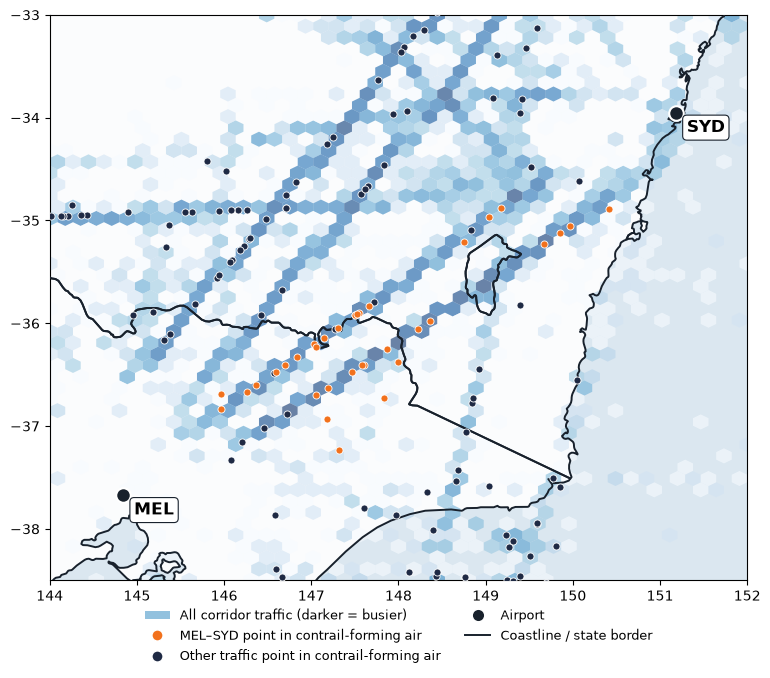
Two main trajectories can be seen that are reasonably busy between Sydney and Melbourne with several points in contrail-forming air, which points to something valuable for future evaluation. Some questions to be asked here include: are these the most popular trajectories for this route and if so, why? What are some of the implications of changing this route, if it reduces the likelihood of entering contrail-forming areas?
What would avoidance look like here?
Contrail-forming layers are wide but only a few hundred metres deep2, so climbing or descending around them is easier than flying around them. The Royal Aeronautical Society also describes vertical avoidance as the “most effective route”3 but says that in congested airspace, horizontal avoidance might be needed. This would be especially applicable if the routes in the plot above are fixed. Changing the altitude however may be harder in a busy corridor like here where flights all share a limited number of altitudes, and more information will need to be studied to better understand this flight corridor.
There are 2 ways to avoid ice-supersaturated regions or ISSRs: pre-tactical avoidance, which is done before the flight departs, or tactical avoidance, where the avoidance manoeuvers are chosen during the flight4. The latter may pose a greater challenge for the workload of air traffic controllers, a role facing reported staffing shortages in Australia5.
Concluding Remarks
It has been fascinating to compare FIFO services in Interior WA with a much busier part of airspace in Australia. As I look at the above map, I am curious on what makes up the busy air corridor between Sydney and Melbourne. FIFO services tend to be in rural SA, QLD and WA - are they virtually non-existent here? If not, then which group of flights make up the “other” seen in the chart, and are they international or domestic?
Another thing to consider is that my hit rates here counted whether a flight passed through a square where a persistent contrail is likely. However, warming varies between contrails. As mentioned in Entry 3, night-time contrails create more warming than daytime contrails as they only trap heat rather than reflect it. This difference is currently not captured in my analysis, and needs to be covered in the future to better understand which flights have the most impact on the climate. For a start, it would be worth checking whether the hits I found were mostly night-time contrails.
References
[1] OAG (2025). Busiest Routes in the World 2025.
[2] Jaramillo, P., Kahn Ribeiro, S., Newman, P., et al. (2022), Transport. In Climate Change 2022: Mitigation of Climate Change, Contribution of Working Group III to the Sixth Assessment Report of the Intergovernmental Panel on Climate Change (IPCC) — Chapter 10: Transport, p. 1089 (doi:10.1017/9781009157926.012)
[3] Royal Aeronautical Society, Greener by Design Specialist Group (2023, April). Contrails and contrail management [Briefing paper].
[4] Transport & Environment. Contrail Avoidance.
[5] Kennedy, J. (2026, August 10). Sydney Airport near miss 'could have been far more serious', air safety boss says. ABC News.