Entry 7: When Real Flights Meet Contrail Skies
Entries 5 and 6 had limited ADS-B (air traffic) data, resulting in the flight traffic data and contrail data being from different time periods: we had to overlay March 2026 OpenSky flight traffic data on winter 2025 contrail grids.
In this post, both datasets cover the same eight-day window of 3-11 April 2026, which will give us a more accurate picture of the relationship between contrail formation likelihood and air traffic in Australian skies.
Datasets
Dataset A: contrail_grids
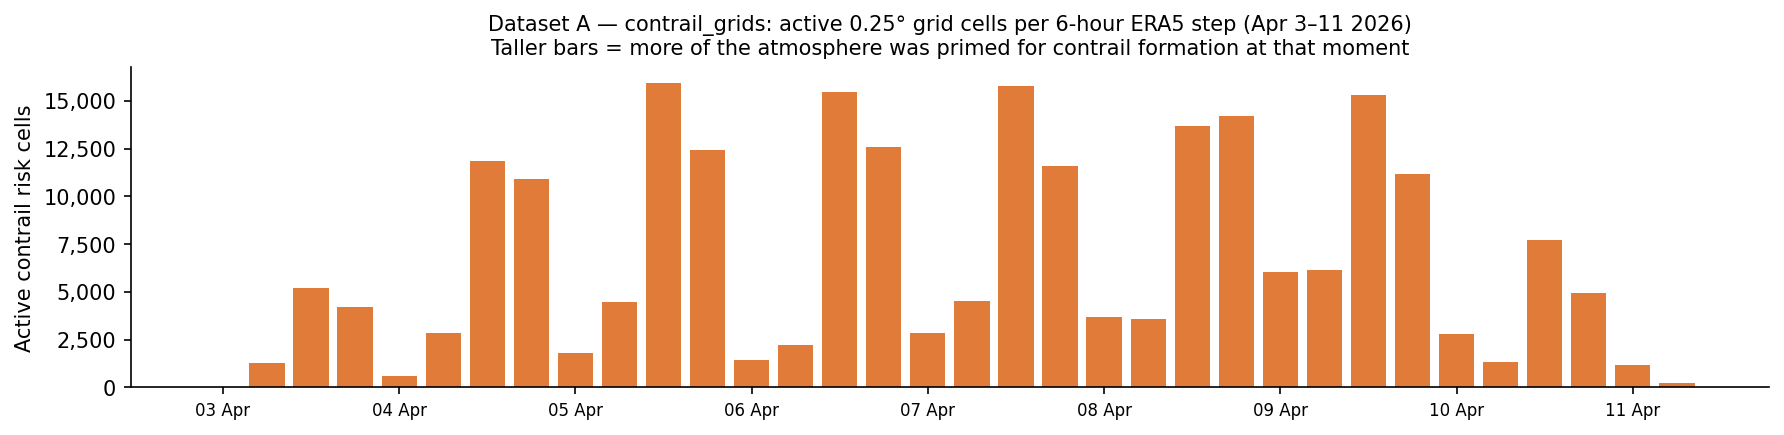
This is the Google Contrails API data. It splits Australia’s airspace into squares about 28 km wide. Every 6 hours, a weather model assesses whether a contrail would form if a plane flew through there with a continuous CFI float value between 0 and 4. My dataset only retains squares with a value greater than 0.001.
The dataset is in Autumn 2026, and a lot smaller in size compared to previous datasets during the Winter 2025 timeframe. The difference in results could be explained by the different climate conditions across seasons in the Southern Hemisphere, but the two datasets also cover different years and lengths of time, so they aren’t exactly comparable.
To summarise Dataset A:
| Attribute | Value |
|---|---|
| Source | Google Contrails API |
| Period | 3–11 April 2026 |
| Temporal resolution | 6-hour intervals (00:00, 06:00, 12:00, 18:00 UTC) |
| Spatial resolution | 0.25° × 0.25° grid (≈28 km at Australian latitudes) |
| Altitude range | FL270–FL440 (18 levels) |
| Total rows stored | 234,817 cells (CFI > 0.001) across 36 snapshots |
The figure below shows how each bar represents one 6-hourly forecast snapshot.
Dataset B - flight_snapshots
Dataset B uses ADSB.fi, a free alternative to OpenSky that provides community-driven and crowdsourced air traffic data.
The data was collected using a Github workflow titled collect-flights.yml, which runs a script called collect_flights_adsb.py every 30 minutes. ADSB.fi then returns a big JSON blob with one aircraft per entry. The script filters to only accept aircraft above FL200 (20,000 ft), making sure they are airborne.
| Attribute | Value |
|---|---|
| Source | ADS-B.fi open API (12 tiling circles) |
| Period | 3–11 April 2026 |
| Poll frequency | Every ~30 minutes (472 polls over the window) |
| Total rows | 30,150 |
| Unique aircraft | 1,560 distinct ICAO hex addresses |
| Altitude filter | FL200 and above only |
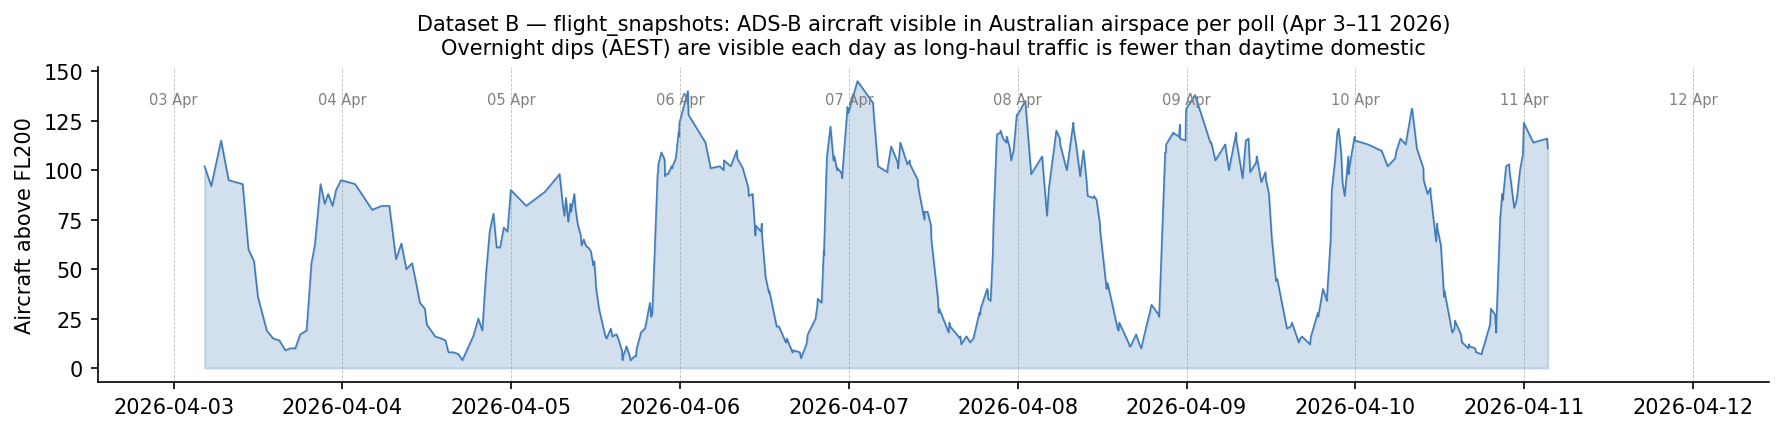
The plot below illustrates Dataset B, air traffic over time in Australian skies. The troughs represent AEST night (~ UTC 12:00-22:00) when fewer aircraft are at cruise altitude. Daily peaks coincide with the busy late-morning domestic period.
Let’s combine both plots together.
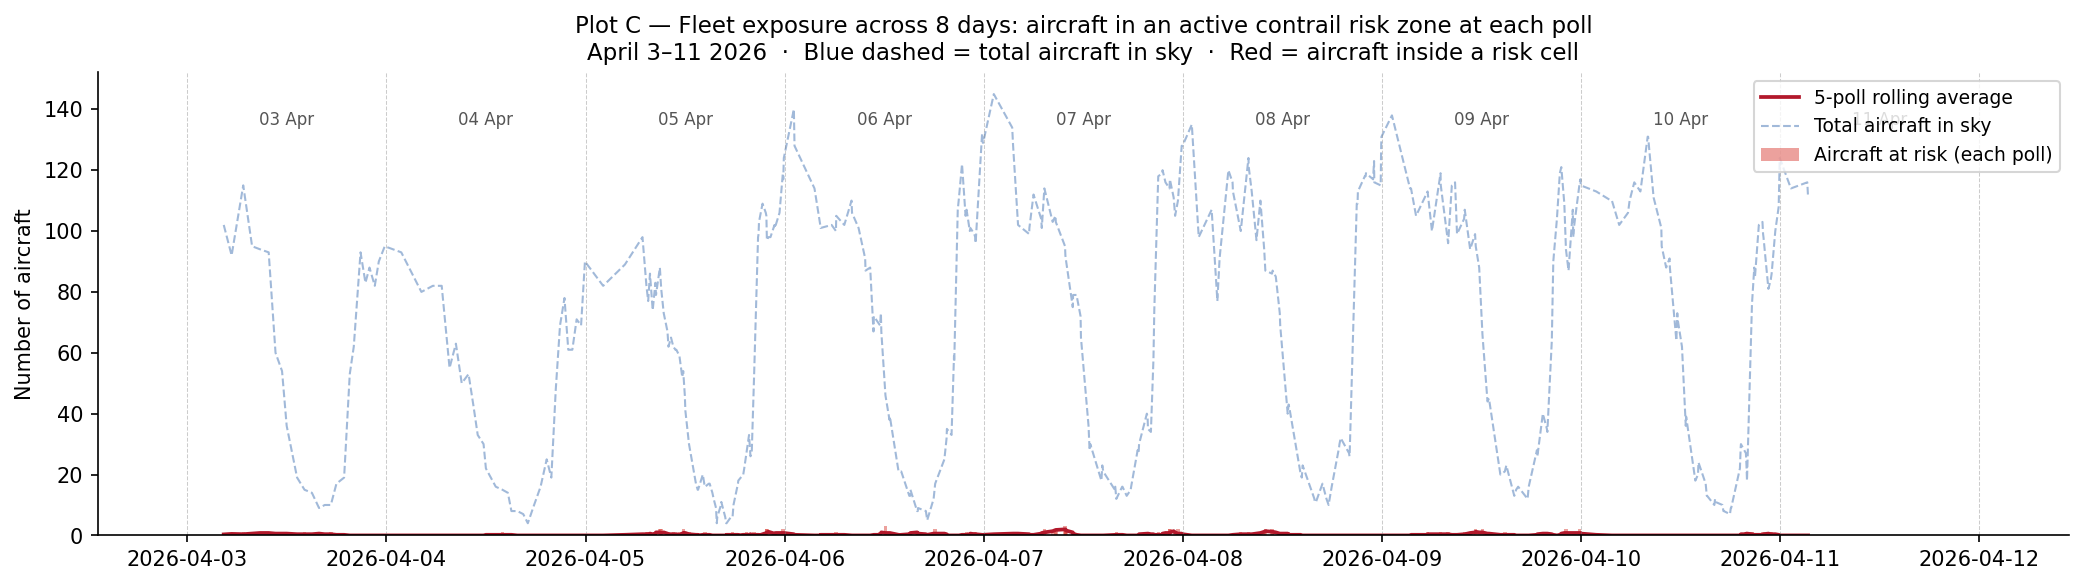
This way, we can investigate: how much of all the aircraft in Australian skies is exposed to contrail-risk regions at one time? Each snapshot captures how many aircraft were inside an active contrail risk cell at a point in time. The blue dashed-line shows the total aircraft in the sky at each poll and the red line shows how many of those aircraft were at risk.
For most of the 8-day window, the red and blue lines are far apart with only few aircraft (around 0-3) inside a contrail risk cell compared to up to 140 aircraft in the sky. So exposure was a small fraction of traffic throughout with no clear spike on any specific day.
Where does this risk occur (on an Australian map)?
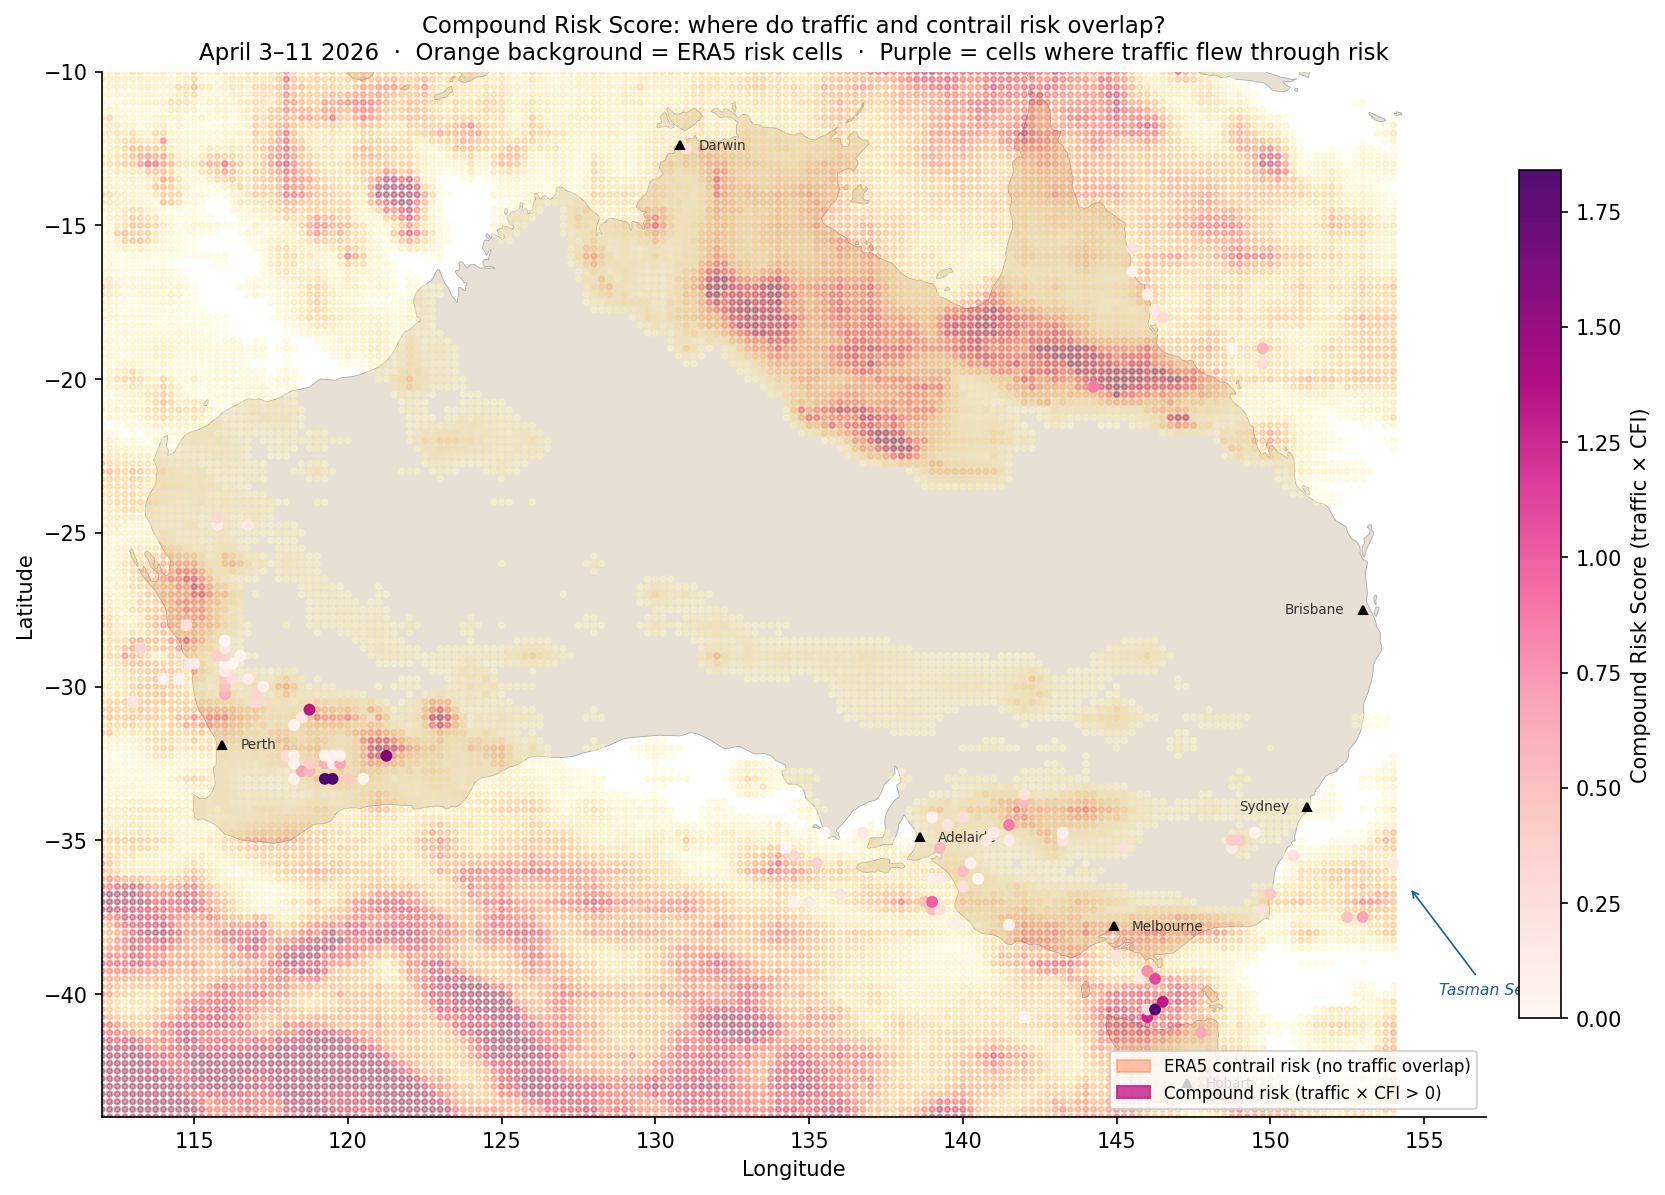
The heatmap placed over the map of Australia below shows the Compound Risk Score (CRS) = total aircraft observations in that cell x mean contrail forcing index, meaning cells where aircraft flew through active contrail risk.
There are some notable clusters of purple - the Western Australia interior and Bass Strait. The Tasman Sea to the right also showed some intersection of contrail risk and flight traffic to a lesser extent than seen earlier in Entry 5.
What time of day is contrail risk the highest?
The below plot combines 8 days’ worth of data into one single 24-hour UTC clock that identifies at what time contrail exposure peaks.
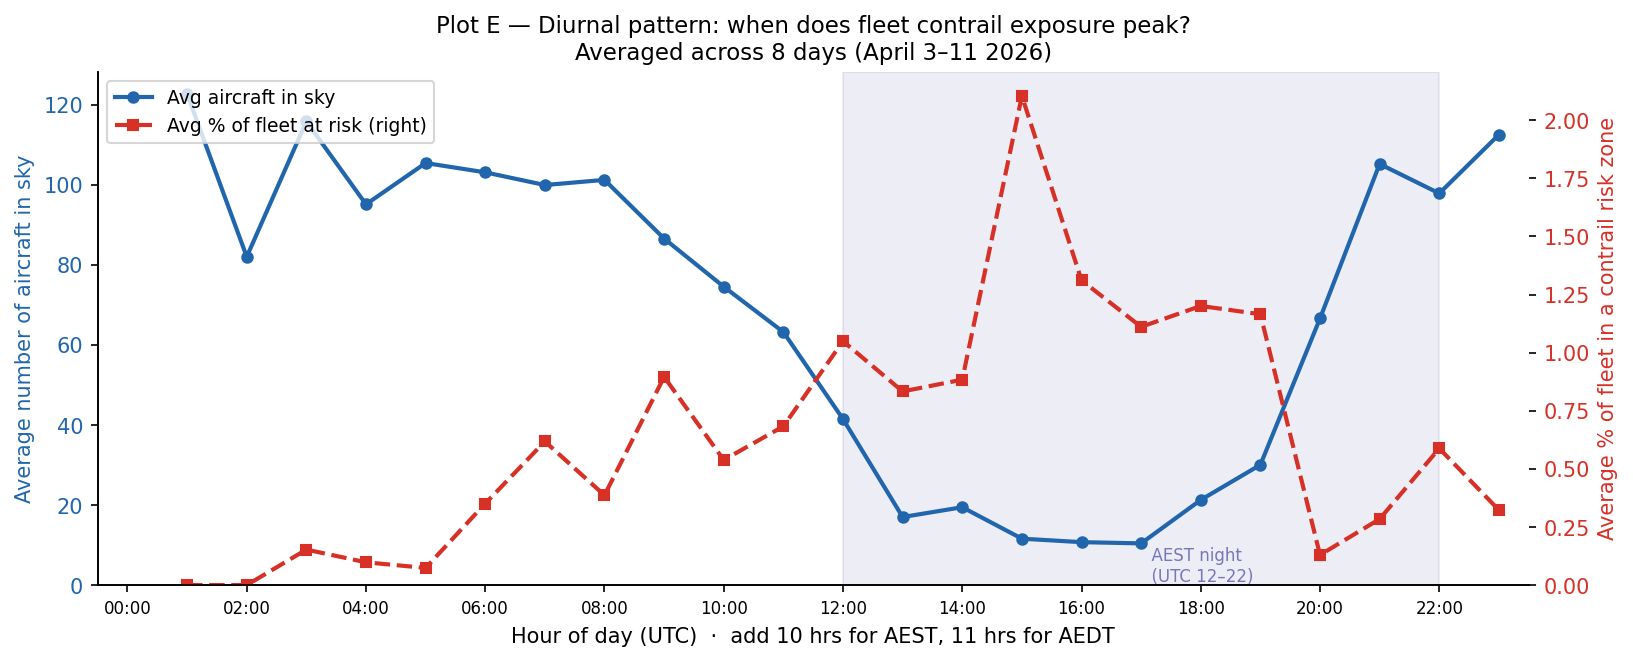
The blue line (left axis) shows the average number of aircraft in the sky at each UTC hour. This shows a low at AEST night and a high across the daytime domestic period (peaking around UTC 0:00, which is ~10:00 AEST).
The red dashed line (right axis) shows the average percentage of active fleet inside a contrail risk zone at each UTC hour. This peaks at 15 UTC (01:00 AEST), so the middle of Australian overnight with a low at 01-02 UTC (11:00-12:00 AEST). This matches what was observed earlier in Entry 3.
The key finding here is that the hours with the most air traffic (UTC 22:00-02:00, morning to midday AEST) are not the most prone to contrail exposure, but rather the quieter overnight window.
Questions + Takeaways
Takeaways:
-
In addition to the Bass Strait and Tasman Sea, another area of interest identified for contrail formation risk is the interior of WA.
-
The overnight window is when the highest risk of contrail formation occurs rather than the hours when there is the most air traffic.
Food for thought for the next entry:
-
How does this dataset from April compare to other months?
-
What weather data can we use to understand the changes in at-risk aircraft?
-
What causes the WA interior, Bass Strait and Tasman Sea to have a higher risk of contrail formation?