Entry 8: Examining Interior WA
Some regions identified in past entries included the Bass Strait and Tasman Sea. These were areas where climate conditions made contrail formation likely, but also where air traffic was high enough. For the Tasman Sea, we can imagine flights between Australia and NZ, and Bass Strait includes flights from the Australian mainland to Tasmania.
One region that was also discovered last entry was Interior WA. Today’s entry will take a look at this in more detail from a purely data point of view.
The Data
While entry 7 had eight days’ worth of data that aligns between ADSB air traffic and Google Contrails data, for today’s analysis, we have data spanning across 24 days between 3-26 April, 2026.
The ADS-B dataset contained over 9,000 entries. From this, we came up with a yes/no flag on a single aircraft sighting. If at that moment, a plane is inside a grid cell with CFI>0.001, the sighting is counted as “at-risk”. A single plane can have multiple counts inside an at-risk cell, and unlike the previous entry, it is not a compound score of the CFI and air traffic.
In code, this was written as follows:
# contrail_prob = the CFI in the grid cell each sighting was
#                 snapped to (0 if the plane was in clear air)
exposure["in_risk"] = exposure["contrail_prob"] > 0.001   # > 0.001  →  at-risk (True / False)
n_at_risk = exposure["in_risk"].sum()                     # count the True's
To narrow down the dataset to WA, we created a bounding box around the clustered at-risk observations seen in Entry 7, the coordinates being: 112.5–122.5° / -34.5° to -27.5°.
Our data can now be summarised as:
| Value | |
|---|---|
| Window | 3–26 April 2026 (24 days, date-matched) |
| Aircraft observations in the box | 9,776 |
| Observations inside active contrail air | 136 (1.39%) |
| Distinct at-risk aircraft | 87 |
| Days with at least one at-risk flight | 9 of 24 |
At-Risk Observations Across the 24 Days
Our first plot shows the amount of at-risk observations across the 24-days.
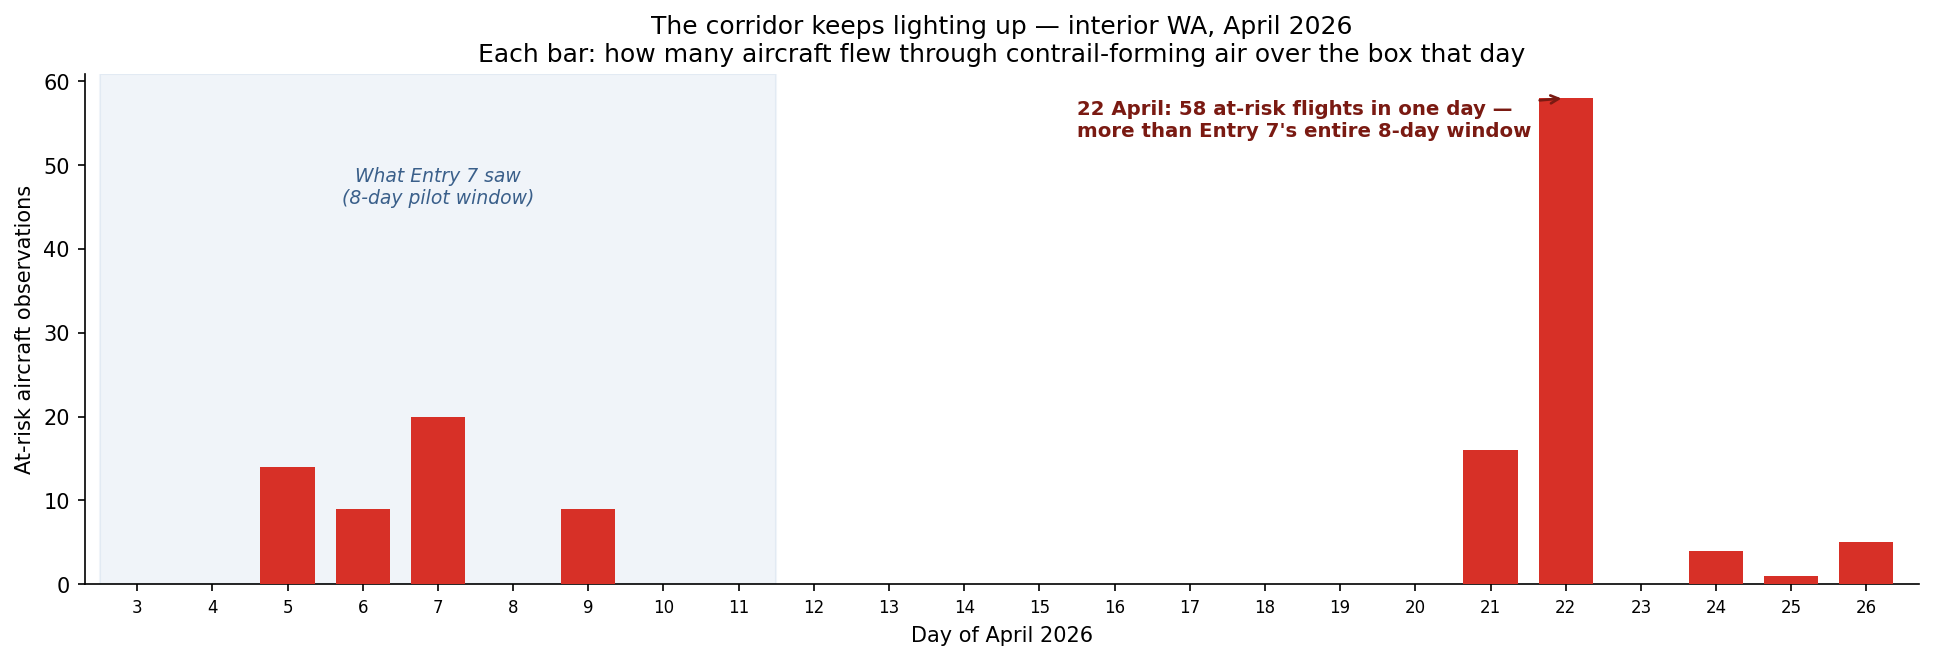
What’s interesting to observe is that there are lots of days where at-risk observations are little to zero, and there are several days with notable “spikes”. The most prominent example is April 22, which accounts for 43% of all observations from our dataset.
The spike is not caused by increased air traffic, as air traffic remains steady throughout and 22 April was an ordinary day in terms of air traffic. It would be interesting to look into other factors that may have caused this, such as humidity and temperatures that day.
At What Height Did Airplanes Get Caught in Contrail-Forming Air?
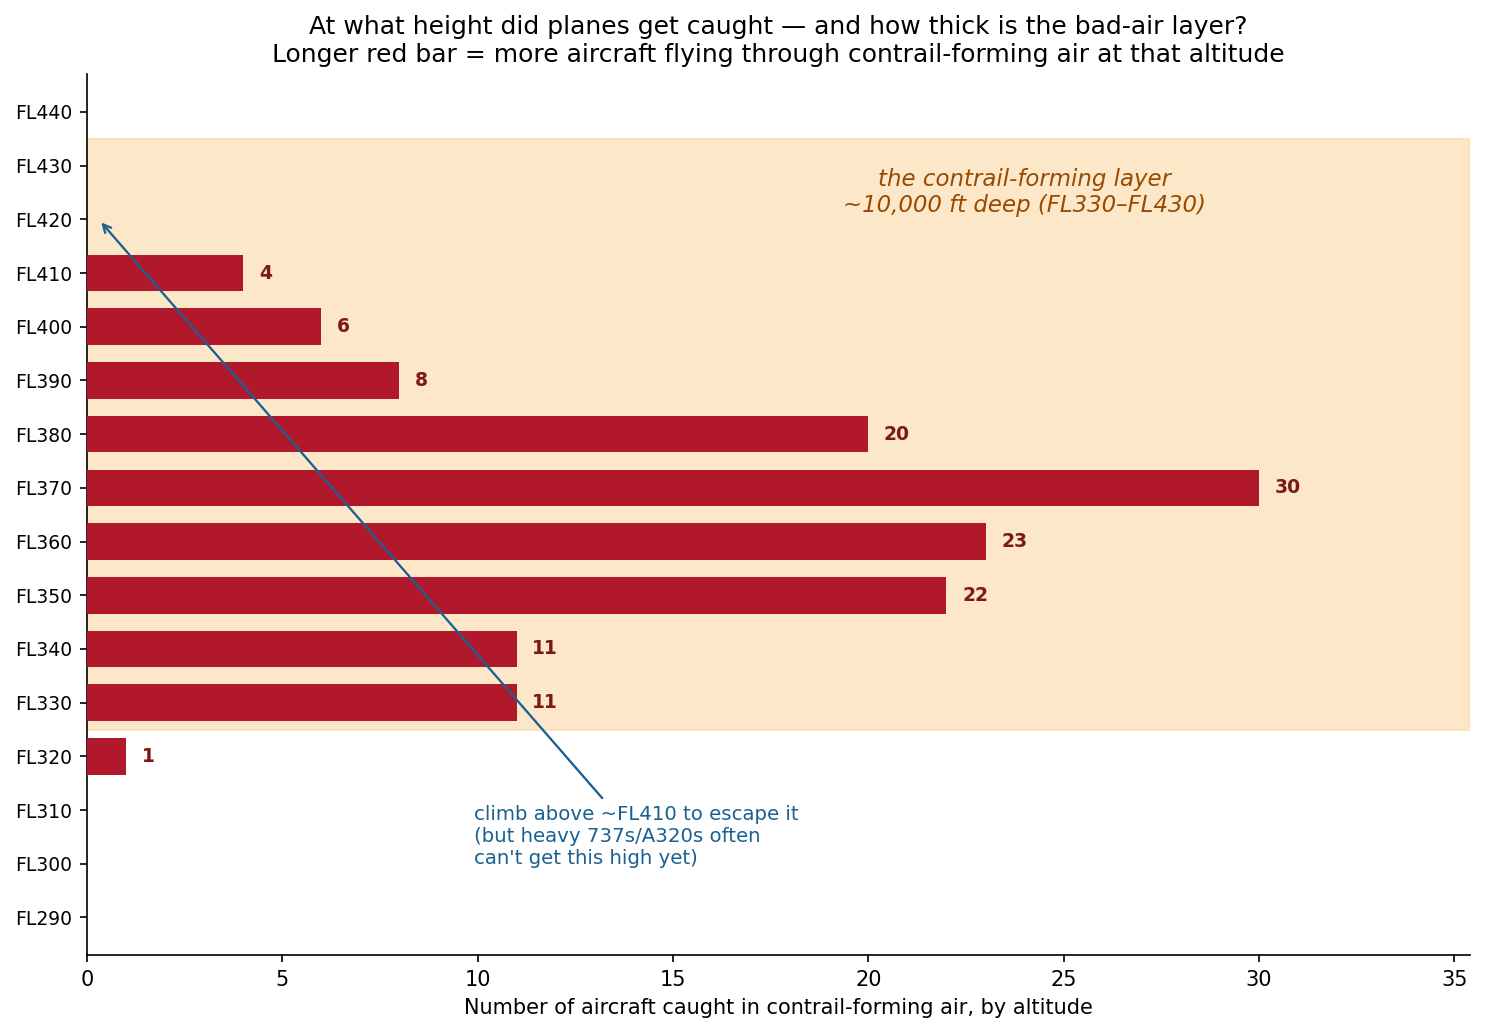
The altitudes range from around FL330-FL410, which spans around 10,000 ft deep. There is a noticeable peak at around FL370, which is standard narrowbody cruise altitude. This is some food for thought, as it may pose a challenge for any altitude avoidance strategies.
If contrail-forming air can be anywhere across this range of altitudes, avoiding it with altitude-avoidance strategies can also result in an increase in fuel burn. However, researchers at Imperial College London1 and the University of Cambridge2 found that the warming avoided more than offset this fuel burn.
Map of Observations by Contrail Forcing Index
Below is a way to visualise everything from a bigger picture point of view with routes out of Perth visible.
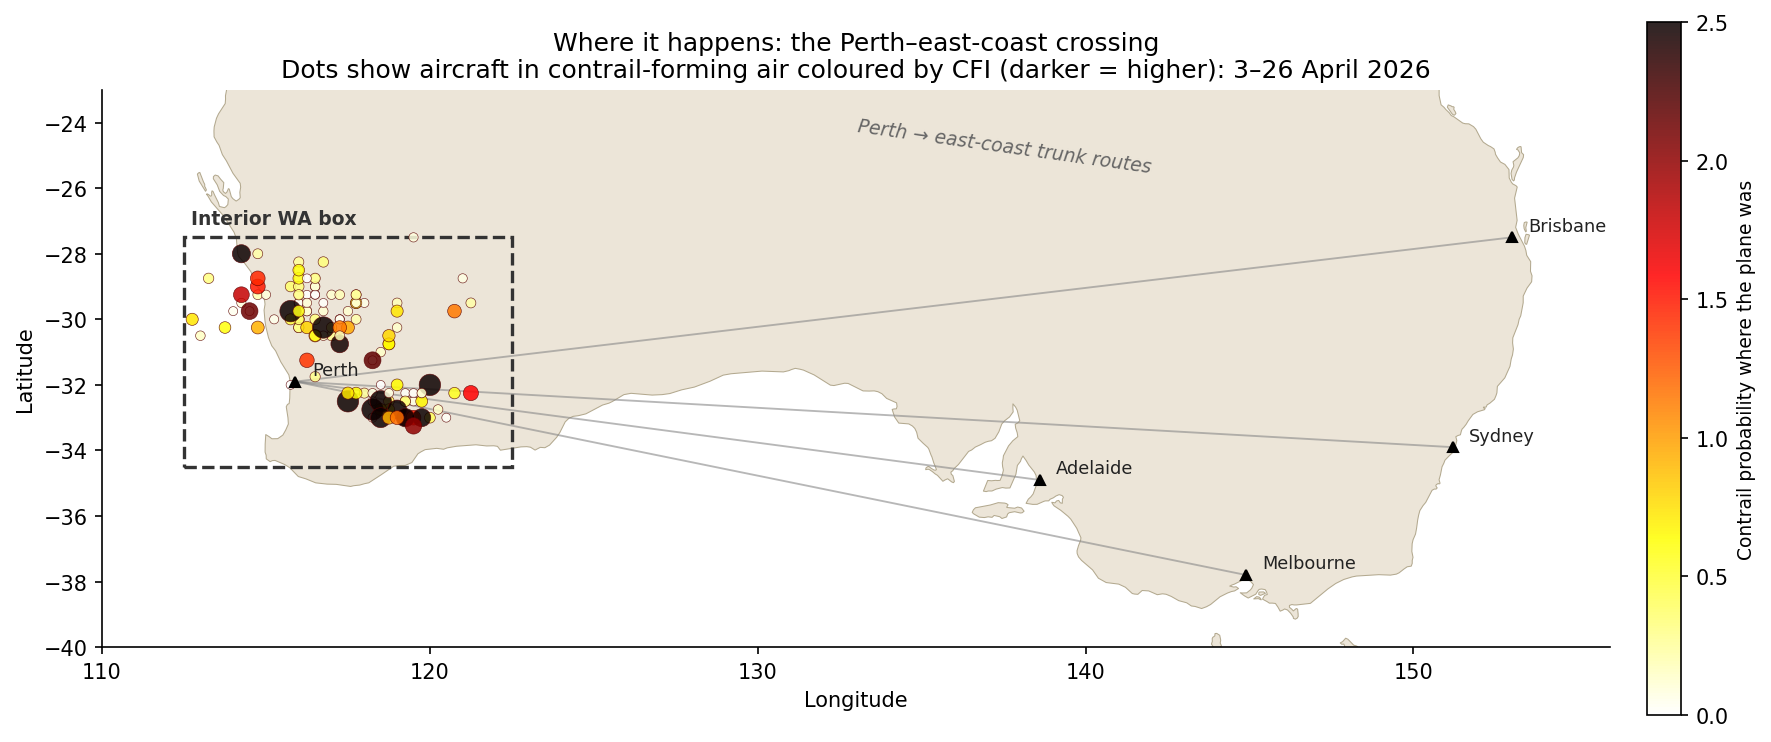
Looking at the data more closely, it is not one route responsible for most of the data points, but it is distributed well across multiple routes. The busiest callsign appears four times.
| Operator | At-risk obs | What they are |
|---|---|---|
| Virgin Australia (VOZ) | 41 | Perth–east-coast trunk (737) |
| Network Aviation (NWK) | 21 | Qantas-owned FIFO mining charters within WA |
| Qantas (QFA) | 18 | Perth–east-coast trunk (737/A330) |
| Jetstar (JST/JTE) | 14 | Low-cost domestic + Perth–Singapore |
| Everyone else combined | ~42 | Mostly foreign carriers transiting Perth |
One interesting observation above is “Network Aviation” at second place, which are all of the FIFO (fly in, fly out) operations between Perth and remote WA for mining work.
Below is also the distribution by aircraft type:
| Aircraft type | At-risk obs |
|---|---|
| B738 (737-800) | 45 |
| A320 | 19 |
| A21N / A319 (neo + classic) | 14 |
| F100 (Fokker 100 — FIFO) | 9 |
| E190 | 8 |
| B788 / B38M / A332 / A388 … | the widebody + regional tail |
Out of the three regions of interest in Australian airspace, Interior WA intrigues me a lot because it is an interesting case where there is an entire industry that requires people to fly short-haul constantly for their commute. More to come in my next post to unpack what FIFO is.
References
[1] Teoh, R., Schumann, U., Majumdar, A., & Stettler, M. E. J. (2020). Mitigating the climate forcing of aircraft contrails by small-scale diversions and technology adoption. Environmental Science & Technology, 54(5), 2941–2950.
[2] Smith, J. R., Grobler, C., Hodgson, P. J., et al. (2026). The climate opportunities and risks of contrail avoidance. Nature Communications, 17, 2092.