Entry 9: Exploring FIFO Charter Flights
Last time, my discoveries into Interior WA, an area I knew little about, revealed a large number of flights for FIFO work. In this entry, I plan to take a glance at what FIFO work is, and how it’s represented in my growing dataset.
What is FIFO work?
Growing up in South Australia, I was familiar with the term FIFO meaning “fly-in, fly-out” and its association with the mining industry with places such as Olympic Dam listed as destinations on small regional flights. In terms of those who work in the FIFO industry, what comes to mind is people who wear hardhats and hi-vis vests, but I imagined all sorts of people connected to the industry including site engineers, tradesmen and executives.
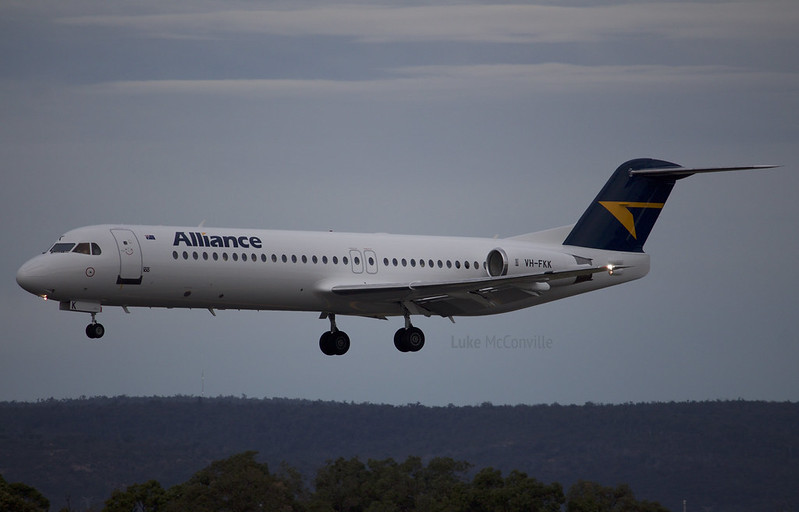
Some preliminary research reveals that FIFO work takes place primarily in QLD and WA as these states have a lot of mining sites and involves specialists coming into the site to do work over a rostered period. Some of the roles include engineers, electricians, security guards, nurses, chefs, etc1.
I was curious why people would choose to repeatedly commute instead of relocating, which could provide a lot of opportunities for the area near the mining site. An article by Windle and Rolfe2 revealed that salaries would need to be increased significantly for someone to relocate instead of FIFO work. It seems that the Australian mining industry is very reliant on this kind of work.
From one article3, I found some examples of the typical rosters FIFO workers take on:
- 8/6 (work eight days, have six days off)
- 2/1 (works two weeks, one week off)
- 4/2 (work four weeks, then two weeks off)
- Even time: equal time on-site and off-site
To gain a better idea of what FIFO scheduling looks like, I decided to look at my own dataset. In Entry 8, we can see that there was a carrier called “Network Aviation”, which I found is a Perth-based carrier that provides scheduled and charter services for FIFO workers.4
Exploring FIFO Scheduling with Pandas
My goal is to see how scheduling or flight frequency differs between regional FIFO carriers and the major carriers flying between cities.
In my Jupyter notebook, I imported my ADSB.fi traffic data into a Pandas dataframe. I then filtered the data to Australian airspace using a NaturalEarth polygon, and filtered to only Australian carriers using the list of Australian airlines and their ICAO codes on Wikipedia.
I realised that several factors would need to be considered to determine whether a flight was a FIFO flight: terminal, flight number and some airlines may do both FIFO and intercity routes (e.g. Virgin Australia).
For now, what I chose to do is to pick three airlines that do largely intercity routes (Qantas, Virgin Australia, Jetstar) and three carriers that largely operate FIFO services (Network Aviation, National Jet Express and Alliance Airlines).
The resulting dataframe contained columns including: callsign, airline, latitude, longitude, flight_level, carrier_group.
Plot 1: FIFO vs non-FIFO - Hour of Day
For the first plot, I wanted to view how FIFO vs non-FIFO flights frequency differs in time of day, keeping in mind that ADSB.fi data is real-time traffic rather than scheduled departure. So I grabbed the earliest seen point of each flight and got the following plot.
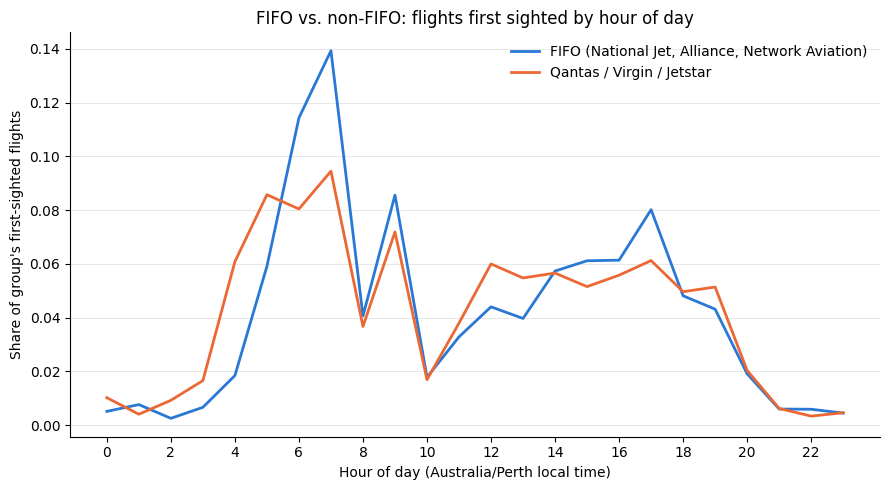
FIFO flights compared to non-FIFO peak around 5am and 5pm Perth local time. Non-FIFO flights represent a higher proportion of all flights before 5am, between 10am-2pm and 6-8pm. This seems to align well with many (paywalled) articles online depicting how extremely early FIFO flights have led to some health concerns over poor sleep quality and risks of car accidents to and from the airport. One example of an article that explores this is Maisey et al5.
Plot 2: FIFO vs non-FIFO - Day of the Week
I also wanted to see whether the above mentioned rosters may be reflected when plotted against the days of the week.
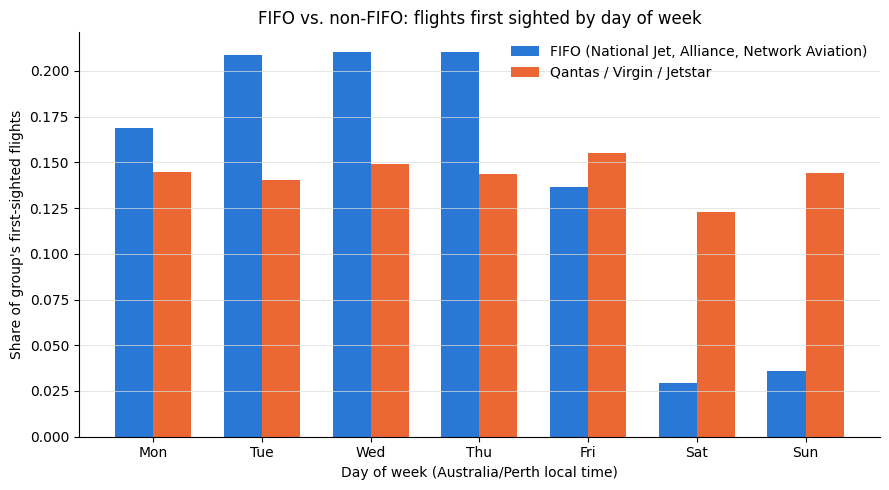
Here we can see that FIFO flights consistently make a higher proportion of air traffic in Australian airspace Tues-Thurs, and then at the end of the week (Fri-Sun), commercial flights make up a much higher proportion.
Looking at information online on FIFO flights and which days on the week they are: one website6 mentions how you fly out at the beginning of the week, typically Sunday or Monday (which contrasts with my dataset which seems to be Monday or Tuesday) and return in two weeks or so repeatedly on a 2:1 schedule. There may be other factors that contribute to the above plot’s shape, such as whether workers fly in their own time or in company time, as this would factor into things such as penalty rates on weekends.
Reflections
Learning about FIFO work from an aviation point of view was intriguing and I see it as something to further look into. Today’s analysis also raises some questions and thoughts:
- Which FIFO routes are more susceptible to crossing regions likely to form contrails?
- How does aircraft type affect contrail formation, given that FIFO flights are considerably smaller than intercity flights? (see Entry 11).
- How does the frequency of FIFO flights vary seasonally?
References
[1] Cummings Economics (2013). FIFO workforce in the Cairns region (Report J2681).
[2] Windle, J., & Rolfe, J. (2013). Using discrete choice experiments to assess the preferences of new mining workforce to commute or relocate to the Surat Basin in Australia. Resources Policy, 38(2), 169–180.
[3] Tim D Smithies, Grace E Vincent, Sally A Ferguson, Gemma Maisey, Holly Fraser, Ian C Dunican, Drilling down on roster design: comparing fly-in fly-out roster patterns in the West Australian mining industry, Annals of Work Exposures and Health, Volume 70, Issue 2, March 2026, wxag007
[4] Qantas Group. Network Aviation.
[5] Maisey, G., Cattani, M., Devine, A., Lo, J., Fu, S. C., & Dunican, I. C. (2022). Digging for data: How sleep is losing out to roster design, sleep disorders, and lifestyle factors. Applied Ergonomics, 99, 103617.
[6] Programmed by Persol. Working FIFO in Australia: Pay, Rosters, Lifestyle and What to Expect.